
- Solutions
-
-
Featured Solution
 Get more value from your existing SAP BW and SAP HANA investments with our SAP integrations.
-
-


This is the first blog in a series on how Pyramid brings time intelligence to analytics.
Central to most analytic systems is the requirement to apply time to an analysis or report. The first and usually simplest component is to view amounts grouped in date “buckets” or periods. We can usually achieve this after identifying the existing date-time field on a data set—which is usually on the “grain,” or transactional detail of the stored data in the database. Once we have this date element (or elements if there are multiple dates), we can use time as a key element in all reporting.
To illustrate this, consider a grid of sale amounts per transactional date that has been converted to a column chart.
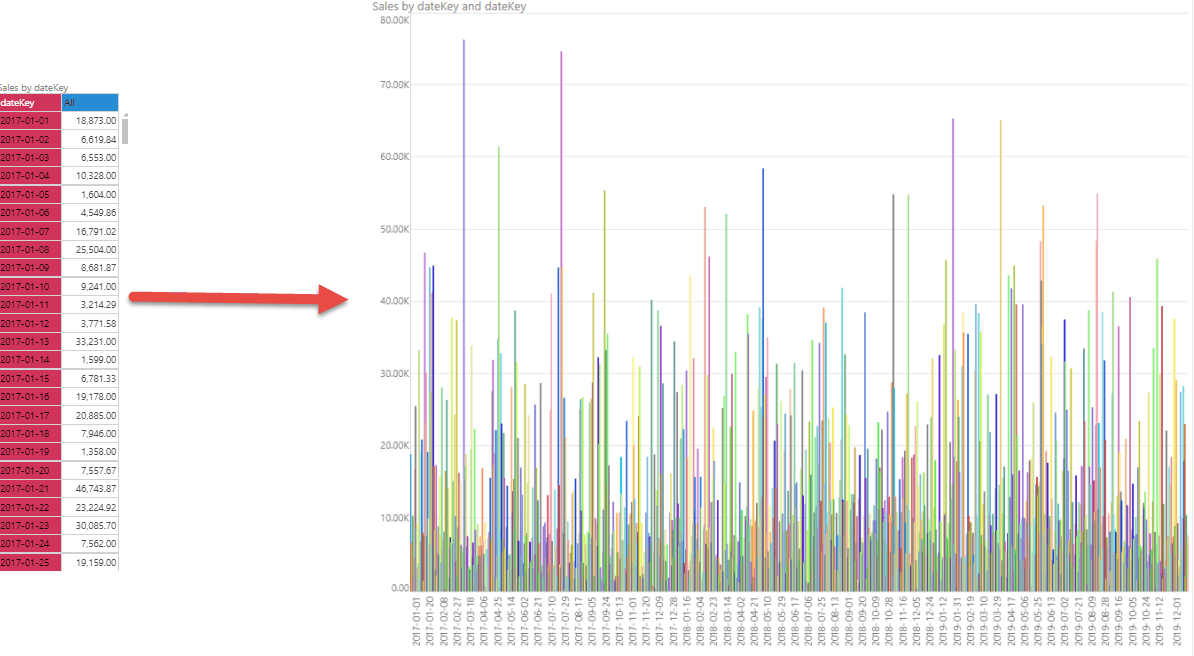
Seeing the data in this example at the individual day level is too granular. We need to add logical super groupings of dates and times to allow the reporting to show more useful period buckets. Grouping amounts into date periods by adding new columns to the data set will allow us to add time intelligence to the original data set.
Using our example, it is difficult to discern performance over the course of the year. One obvious approach is to total the results by month, which we solve by creating a separate “bucket” for each month and summing all sales by each month. From the visual below, we can now see the monthly grouping, a much clearer picture of our sales performance for that year.
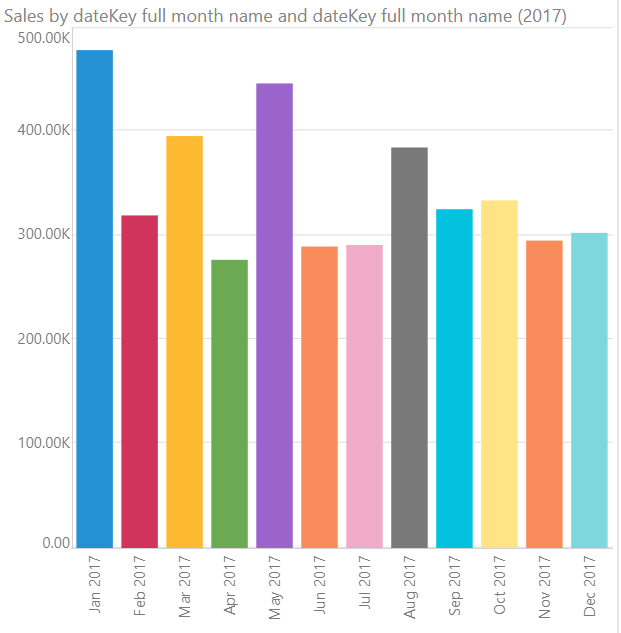
Creating multiple buckets for different date and time scenarios will enable us to analyze our data with more flexibility and clarity.
In the next stage, let’s assume I want to see the sales totals for 2017 and compare them to 2018. Here, I not only do I want to see the data bucketed into annual figures, I also want to see the absolute difference and the percentage change between the annual numbers.
This is the second component of time intelligence: creating calculations over a range of dates and comparing them against previous periods.
![]()
The above scenarios are simplistic but cut to the heart of what most analyses need to repeatedly do: visualize data over time. However, what seems a simple task can be difficult with the wrong analytics tool. Indeed, the challenge of making all logical elements of dates and time can become overly complicated or unworkable. Many BI solutions require users to contort data unnecessarily and manipulate report designs to accommodate complex date and time logic, or leave the user with a handful of clumsy options that force them to do the “clever” stuff in offline tools like Excel.
Pyramid includes an array of tools, wizards, and functions to solve both sets of time-intelligence challenges. The capabilities are highly effective and user-friendly, and work for all data sources and query languages supported by Pyramid (MDX and SQL)—covering the basics all the way through to highly sophisticated functionality.
The next set of blogs in this series will cover these elements in greater detail.

How-To
SAP is essential enterprise software. Your organization has made significant investments in SAP. You've tailored…

How-To
Pyramid’s built-in multi-factor authentication (MFA) option adds a rock-solid layer of security to your BI…

How-To
Administrators occasionally need to check complicated settings and security structures for users. Sometimes the easiest…

How-To
Pyramid lets users customize and personalize the labels of value metrics and hierarchies for a…
How-To
Static data format masks, used to format values in analytics) is a standard feature in…

How-To
Pyramid lets users display multiple value metrics in a single report, each with its own…

How-To
Pyramid’s persistent color feature maintains the same color in all visualizations for selected data elements,…

How-To
Pyramid offers flexible, intuitive security for parent-child hierarchies, providing role-based control over how members are viewed…

How-To
Pyramid excels in its’ native support for parent-child hierarchies, automatically generating hierarchical structures and providing fluid,…