
- Solutions
-
-
Featured Solution
 Get more value from your existing SAP BW and SAP HANA investments with our SAP integrations.
-
-


Pyramid excels in its’ native support for parent-child hierarchies, automatically generating hierarchical structures and providing fluid, intuitive reporting.
Parent-child hierarchies are used to depict the hierarchical, iterative relationship between all members that appear in the same table, enabling a graphic portrayal of the relationships and facilitating the aggregation of all members according to the hierarchical structure. Reporting on parent-child hierarchies is a critical function required in applications that use data structures like a chart of accounts, organizational structures, bill of materials, and many others. Hierarchical reporting for parent-child relationships requires specialized iterative capabilities and is usually difficult or impossible to resolve with alternative workarounds. Pyramid’s extensive support for parent-child hierarchies delivers elegant reporting with full hierarchy expansion and collapse. It provides hierarchical accumulation directly on supported data sources without requiring data ingestion or data source manipulation.
In the first of this two-part series, we’ll explore how Pyramid’s extensive data model capabilities support parent-child hierarchies. In the next blog, we’ll analyze how Pyramid’s querying and visualization capabilities cater to parent-child structures, resulting in fluid and intuitive dashboards and reports.
The unconventional nature of the parent-child hierarchy does not lend itself well to classic reporting and data aggregation. Rolling up or aggregating all members of a parent-child hierarchy in a relational data model requires iterative logic to snake through the hierarchy one item at a time. This places an enormous burden on resources, making it infeasible to process data in its native format. As a workaround, some solutions involve complex pre-processing to flatten the hierarchy, ensuring each child record contains a distinct parent column for all preceding levels. This forces building additional columns back to the data source; or duplicating data to a new data source. And most often, it produces structures that can go stale quickly, so constant hydration is required – challenging the very notion of “a single version of the truth.”
Pyramid’s “Model” app provides a code-free, drag-and-drop interface to define parent, child, and descriptive columns in a data model. Pyramid generates the hierarchical structures on the fly, automatically recognizing all levels present in the hierarchy and generating metadata for each level in the hierarchy dimension. The newly generated data model facilitates direct query on the existing data source, using the parent-child hierarchy to aggregate and display data as needed.
In addition, Pyramid provides several options for calculating rollup aggregates within the hierarchy elements to meet business logic requirements. So, an operand per member element can be used to determine whether each item is added, subtracted, or ignored when aggregating up the hierarchy.
Specifically for accounting applications, another feature – cumulative measure aggregation – can also be added to a data model that applies the accumulation of measures for balance sheet numerical operations. Numerous complex accounting problems can be solved easily and quickly when both the accumulation and operand functionality is combined.
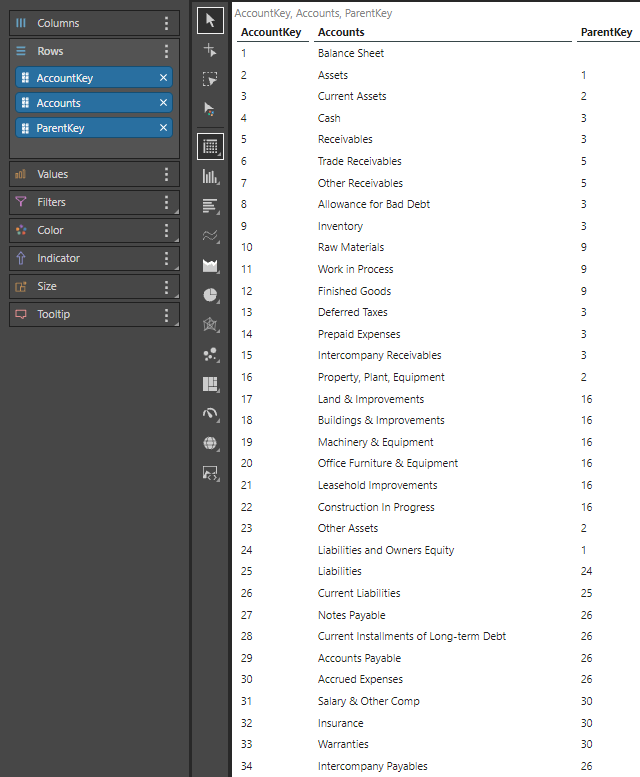
Carla is a BI Analyst at EZ Trading, where they have a SnowFlake Data warehouse with Pyramid for their Analytics. Their chart of accounts defines the parent-child relationship, with many different reporting levels, resulting in a typical ragged hierarchy.
For example, this Discover report reflects how the Balance Sheet is the parent of Assets and Assets is the parent of Current Assets. Current Assets is in turn, the parent of both Cash and Receivables.
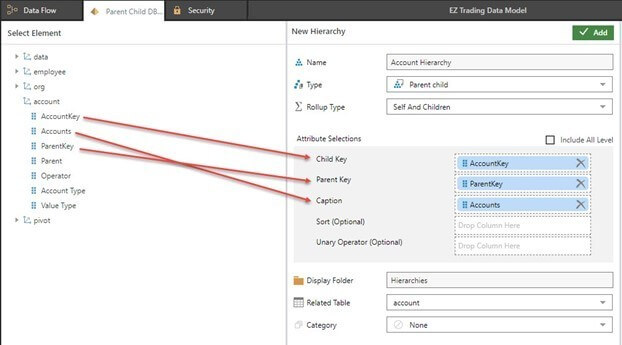
Carla wants to create a data model that will reflect all levels in the financial structure. She used the Model tool to define the parent-child relationships – using the AccountKey to define the Child Key, the ParentKey for the Parent, and the Accounts column to be used as the caption.
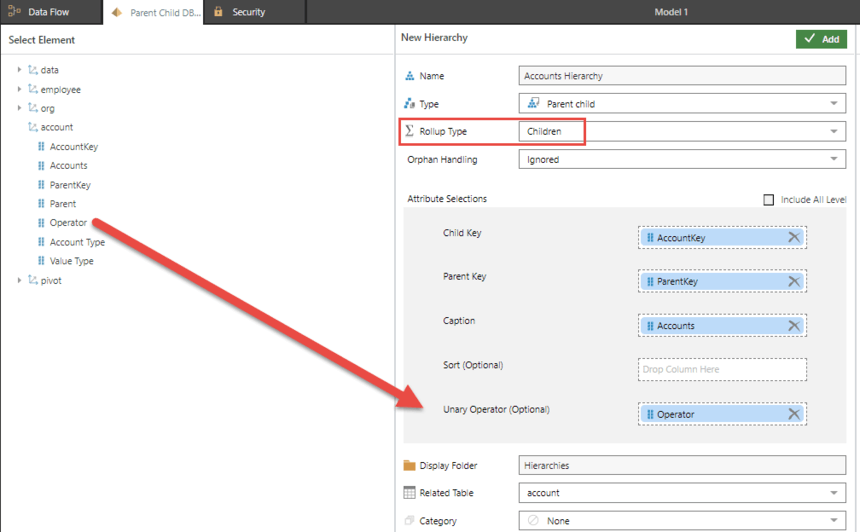
Next, Carla wants to display all values in her chart of accounts as positive, including expenses and sales returns. However, she wants to subtract expenses from revenue to generate a net revenue amount. Carla uses an “operator” column to indicate what to add or subtract when aggregating lower levels – so she drops the “Operator” column into the Unary Operator property. Finally, she defines “Children” as the Rollup type to that any parent element is simply the aggregation of child values.
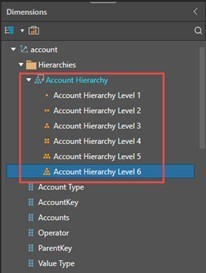
Once the model has been saved, Pyramid instantly generates the hierarchical structure, automatically recognizing the six levels present in the hierarchy and generating metadata for each of the levels in the Account hierarchy dimension.
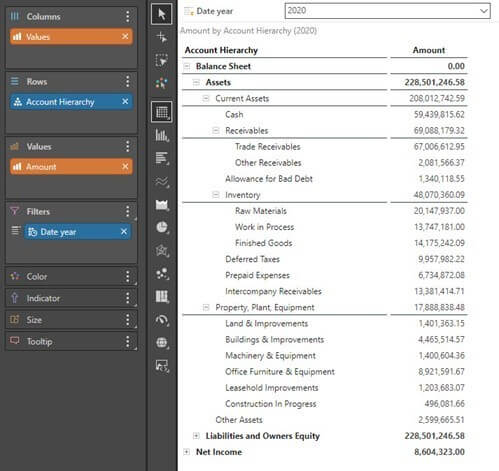
Carla then uses her new model in a report to display the relationship between the accounts and all children and descendants.
We see that asset and liability amounts are displayed as positive amounts. Still, nevertheless, in the background, the unary operator is used to ensure that the balance sheet amount is 0 (by subtracting liabilities from assets).
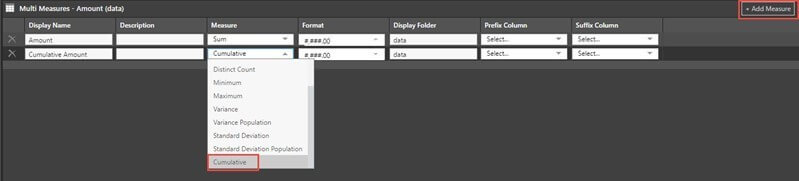
Carla then wants to accumulate the balance sheet amounts from the company’s inception, so she creates an additional measure for the amount column, using the cumulative method to aggregate the amount. This will allow Carla to display this year’s balance sheet amounts without having to apply any complex calculations to include data not shown on her balance sheet report.
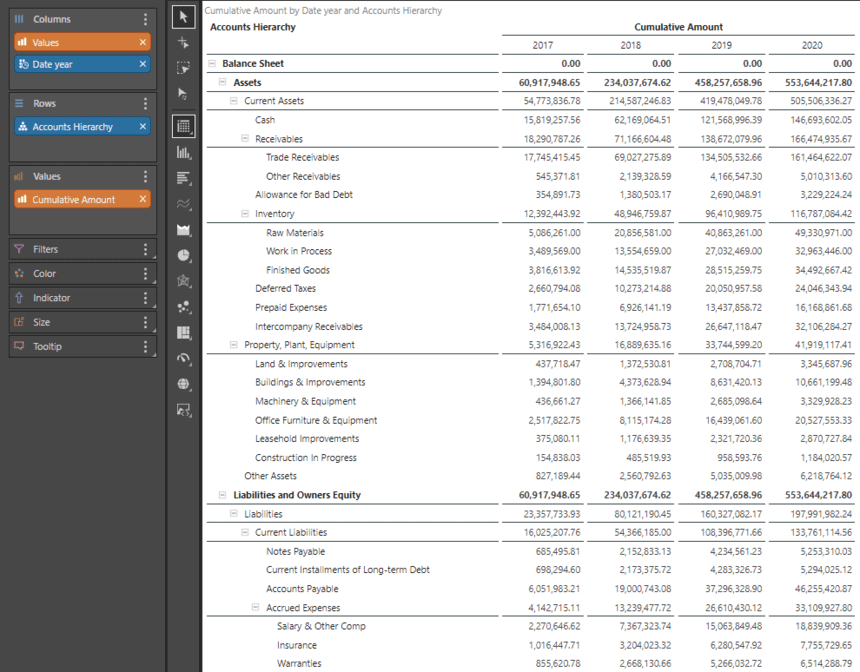
And finally, Carla displays the cumulative balance sheet amounts in a hierarchical tree structure, depicting the annual cumulative effect with simplicity and clarity without requiring complicated manipulations and formulas.
Parent child hierarchies are critically used in financial and other applications to portray relationships between members graphically.
Hierarchical reporting is usually extremely difficult or impossible to resolve, while aggregating members presents an additional burden in terms of both design and resources. Pyramid’s “Model” app provides a code-free, drag-and-drop interface to define the various elements of the parent-child structures on the fly, generating a comprehensive data model, and facilitating direct queries on the existing data source. Several aggregations are available to meet business logic requirements. Cumulative measure aggregation applies the accumulation of measures for balance sheet operations. Request a demo today!

How-To
SAP is essential enterprise software. Your organization has made significant investments in SAP. You've tailored…

How-To
Pyramid’s built-in multi-factor authentication (MFA) option adds a rock-solid layer of security to your BI…

How-To
Administrators occasionally need to check complicated settings and security structures for users. Sometimes the easiest…

How-To
Pyramid lets users customize and personalize the labels of value metrics and hierarchies for a…
How-To
Static data format masks, used to format values in analytics) is a standard feature in…
How-To
Pyramid lets users display multiple value metrics in a single report, each with its own…

How-To
Pyramid’s persistent color feature maintains the same color in all visualizations for selected data elements,…

How-To
Pyramid offers flexible, intuitive security for parent-child hierarchies, providing role-based control over how members are viewed…

How-To
Pyramid provides time-based cumulative measures as a method for aggregating non-additive values on a cumulative…