
- Solutions
-
-
Featured Solution
 Get more value from your existing SAP BW and SAP HANA investments with our SAP integrations.
-
-


In part 3 of my blog series on contextual calculations (see part one and part two), I cover the powerful ability to calculate differences between current and previous row values for a metric and graphically display results in a waterfall chart.
Differences between two metrics are very commonly used to analyze period-on-period changes. Calculating differences often highlights other issues that require further investigation.
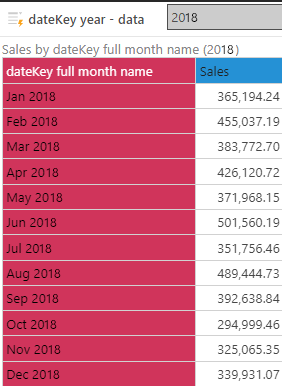
A business user is reviewing monthly sales figures and would like to see the “ups” and “downs” in the numbers as the year has unfolded. In order to achieve this, he would like to see the movements in sales represented in a data visual that is easy for him to grasp the trend.
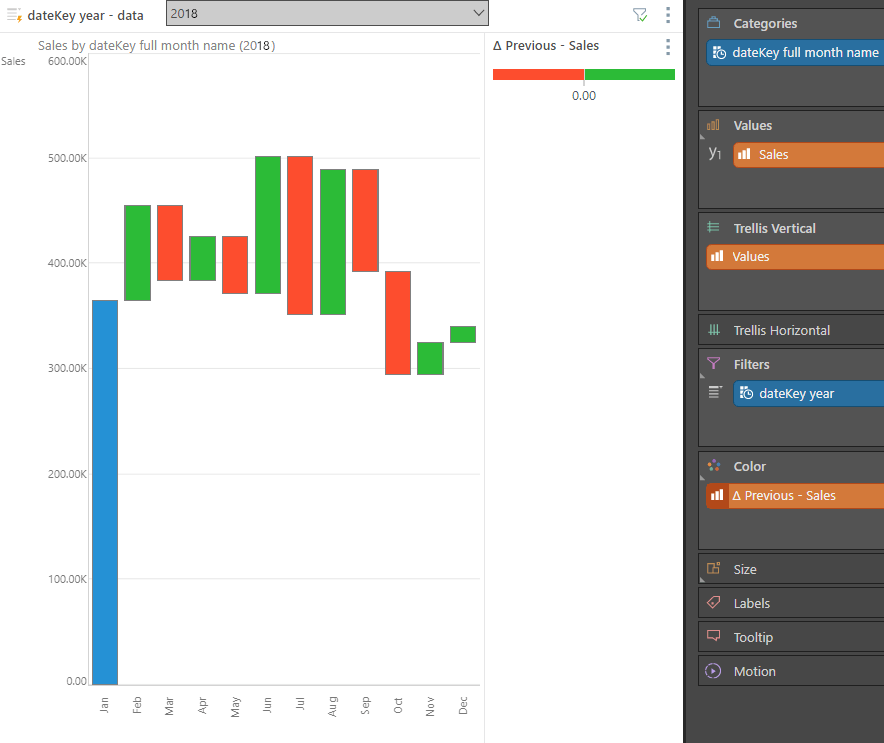
In our example the business user might want to graphically depict the differences in a waterfall chart that is a great visual to see movements highlights while showing increasing amounts in green and decreasing amounts in red.
In most BI tools, this involves tricky coding that requires multiple, complicated, and time-consuming steps. For example, building differential values and waterfall charts in Power BI can be a long and challenging process. Worse, the solution offers no flexibility and hard-codes elements of the query.
With Pyramid you can create an additional calculated difference column in a simple, one-click step with no code required—while still leaving the user the capability to change the calculations intact.
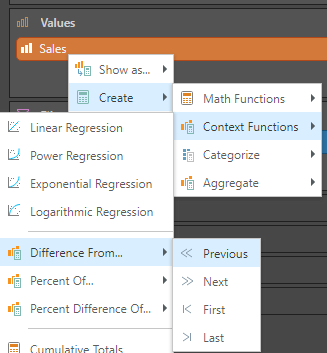
With a single right click on the sales metric, we can choose a differential calculation.
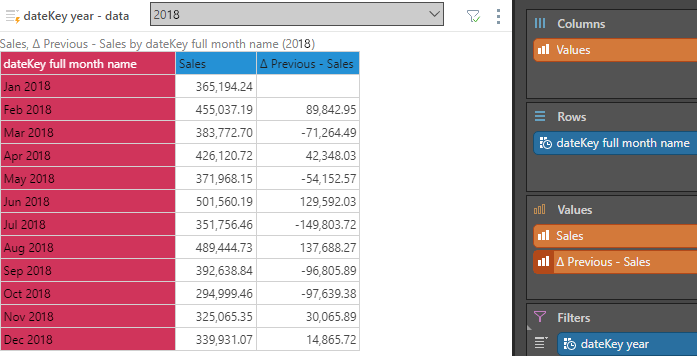
And the period-on period sales difference is instantly shown in our grid visualization.
With one more click, we can use Pyramid’s out-of-the-box waterfall chart to draw both the movements and the color of the movements in a graphic.
For details on this process you can see the video or help here.
With Pyramid, a user can create a difference calculation that:
Pyramid provides a highly versatile, powerful, code-free and user-friendly tool for calculating numerous business analytic applications and reports.

How-To
SAP is essential enterprise software. Your organization has made significant investments in SAP. You've tailored…

How-To
Pyramid’s built-in multi-factor authentication (MFA) option adds a rock-solid layer of security to your BI…

How-To
Administrators occasionally need to check complicated settings and security structures for users. Sometimes the easiest…

How-To
Pyramid lets users customize and personalize the labels of value metrics and hierarchies for a…
How-To
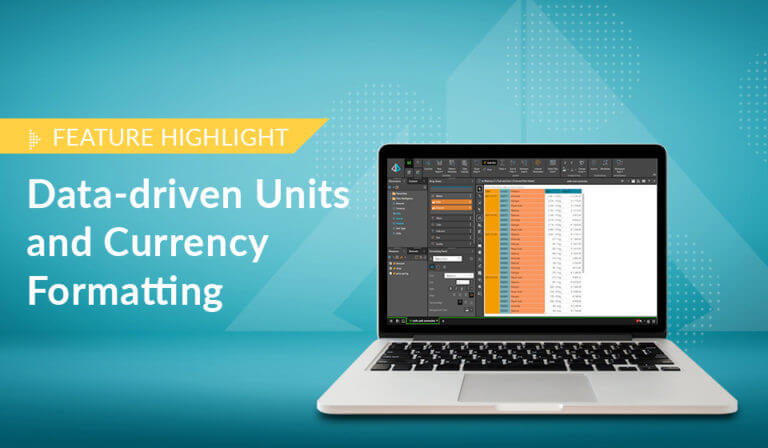
Static data format masks, used to format values in analytics) is a standard feature in…

How-To
Pyramid lets users display multiple value metrics in a single report, each with its own…

How-To
Pyramid’s persistent color feature maintains the same color in all visualizations for selected data elements,…

How-To
Pyramid offers flexible, intuitive security for parent-child hierarchies, providing role-based control over how members are viewed…

How-To
Pyramid excels in its’ native support for parent-child hierarchies, automatically generating hierarchical structures and providing fluid,…