
- Solutions
-
-
Featured Solution
 Get more value from your existing SAP BW and SAP HANA investments with our SAP integrations.
-
-


2020.10 is the latest release from Pyramid Analytics. It extends the functionality introduced in our major 2020 release. This is one in a series of posts that highlights some of the major new features.
The smart Calendar Slicer in Pyramid is designed to make date-time operations fast and simple for both novice and advanced users alike. It is especially useful when more date-time structures in the original data source do not exist, and users do not want to use complex formulas to filter data with dates.
Many data sources do not have extra date-time groupings and values like “year,” “month,” “week,” and “quarter.” This is especially true on relational databases that only have a simple date-time field. Usually, to get the extra “time intelligence,” the data must be manipulated via ETL operations, or the user needs to build and deploy calculations. Sometimes these options don’t exist (because there is no write-back), or the calculations are too complex for a non-technical user.
Many BI tools have real issues in these scenarios because they cannot deliver time intelligence in a direct query model. Often, they resolve this by duplicating the data into their own proprietary databases first. There are two problems with this solution: it doesn’t scale, and it breaks governance.
The “Calendar Slicer” tool in Pyramid represents date selection options in a graphical, non-technical interface. It works directly on any SQL data source (including Oracle, SAP HANA, Exasol, Snowflake, Redshift, etc.) without needing to add time intelligence, change the source, or add any special date-time calculation logic (which is still possible for more advanced time requirements). It handles selections with different granularity settings (dates, weeks, month, quarters, semesters, years); range selections (from, to); formulaic selections (YTD, MTD, last “n” periods); and even lets the user define non-calendar years. It does all this, all while making the process incredibly easy.
Mary, a business analyst at XYZ Component Manufacturers Inc., is using Pyramid to query her Amazon Redshift data warehouse (which contains 10B records). The sales data is stored in a classic snowflake schema, with all date-time values stored as the transactional dates of each order in the system.
Mary needs to analyze sales and quantity values by the manufacturer by looking at data for a given month or quarter. However, she doesn’t have month and quarter groupings in the database and she is not technical enough to create these time intelligence columns. Worse, the DBA’s are reluctant to make adjustments to their data warehouse—“it’s too big,” they say.
Luckily, the Calendar Slicer tool helps Mary resolve the problem instantly.
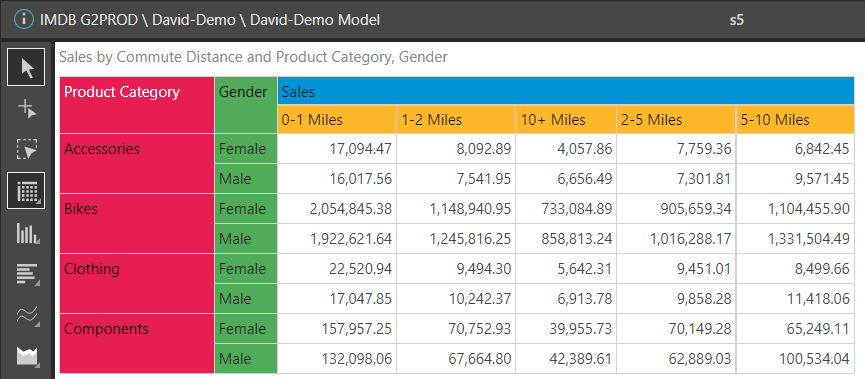
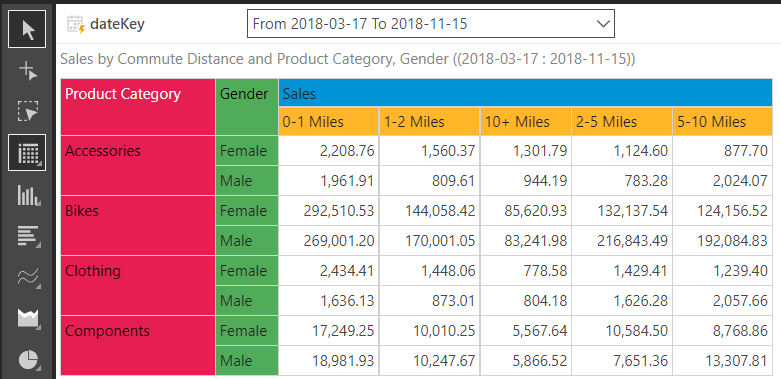
In the diagram below, we see a Sales Report by product category, gender, and commute distance with no dates selected.
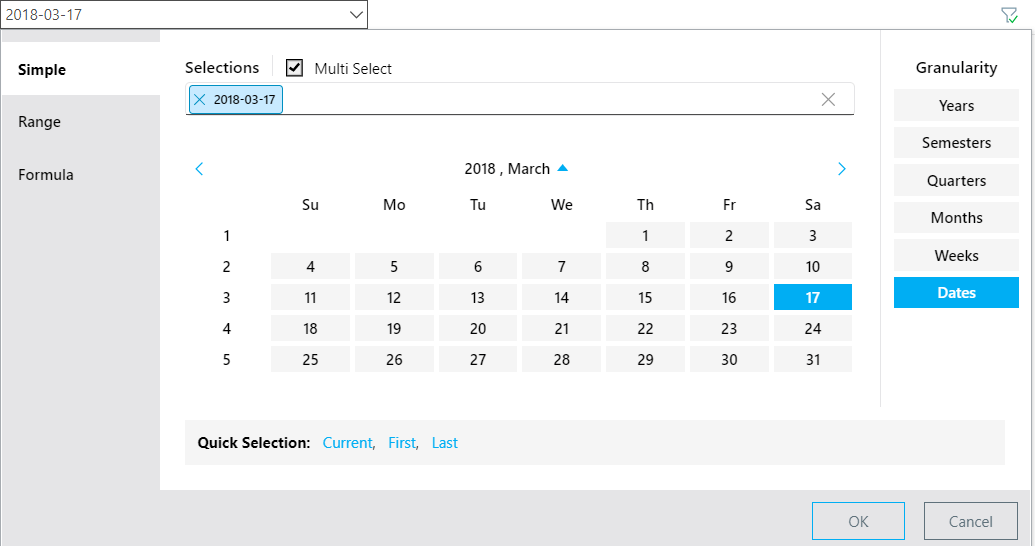
Mary simply drags the date columns to “filters” and it automatically builds the Calendar Slicer. Mary now uses the slicer to select the 17th March 2018, from a classic calendar UI that is easy to traverse from dates to months or years.
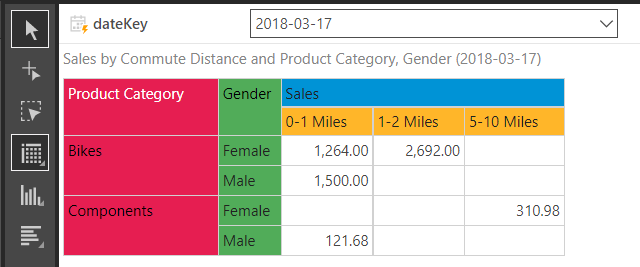
The resultant report has now been filtered for 17th March, 2018. The selection and breadcrumb at the top of the report clearly indicates the selected date.
Mary now uses the calendar slicer to select all records from the 17th March 2018, until 15th November 2018. She selects the range option, and then selects “from” and “to” dates from the two calendar slicers.
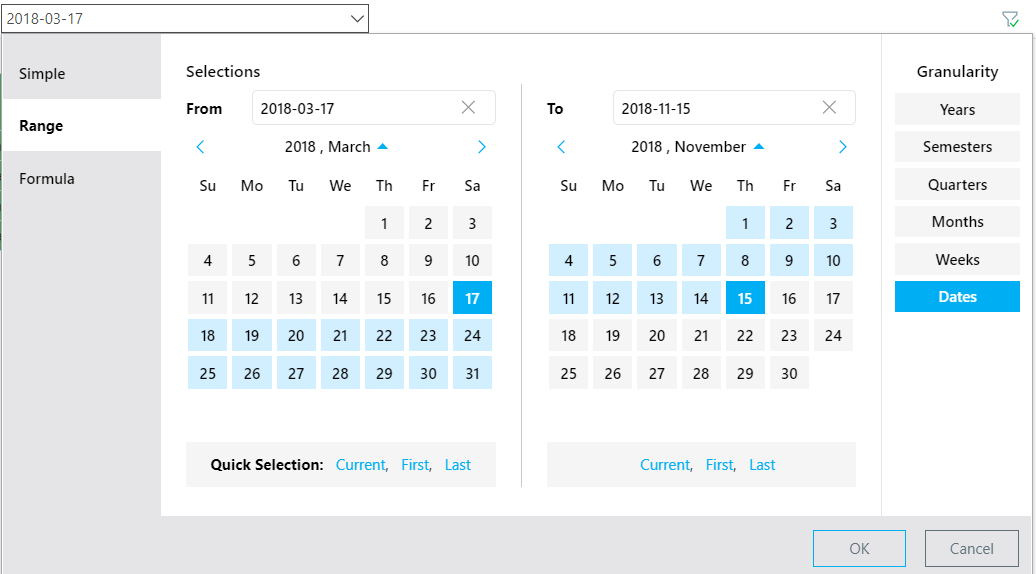
The results are displayed immediately as per the selection, and can be seen in the breadcrumb at the top of the report.
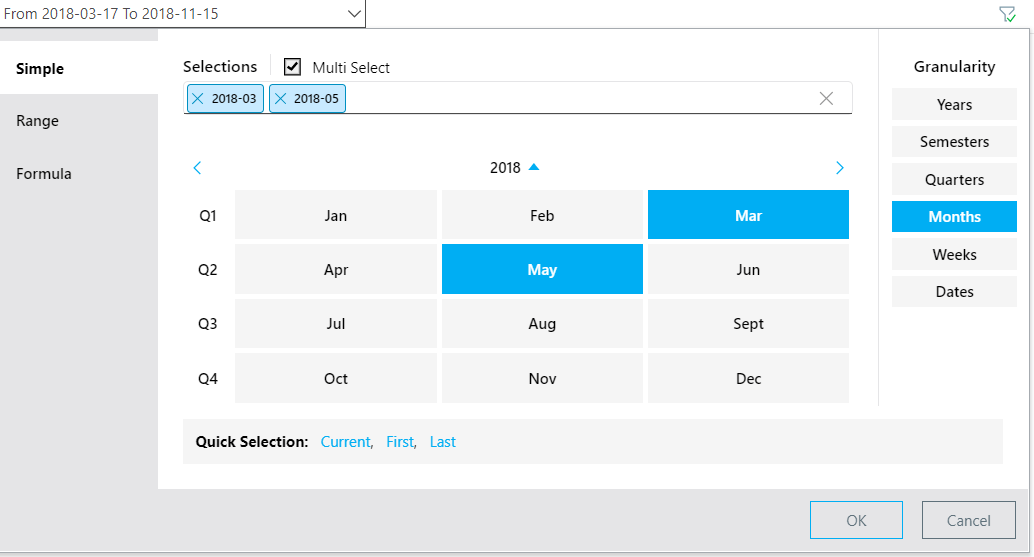
Mary now uses the calendar slicer to select all records for March and May 2018. She selects the “simple” option, and then selects the “months” granularity, picking the two relevant months from the calendar slicer. Despite the fact that the year, quarter, month, and week columns do not exist in the database, all of these options are available in the calendar slicer as if they were.
(Note that many sequential or non-sequential months can be selected with the “Multi Select” option checked.)
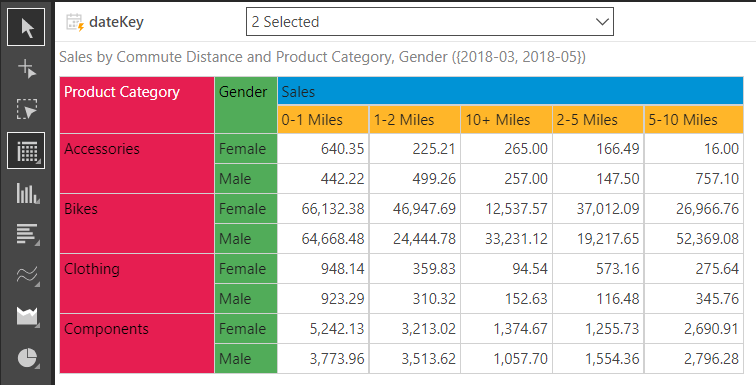
The results are displayed immediately as per her selection, as can be seen in the breadcrumb at the top of the report.
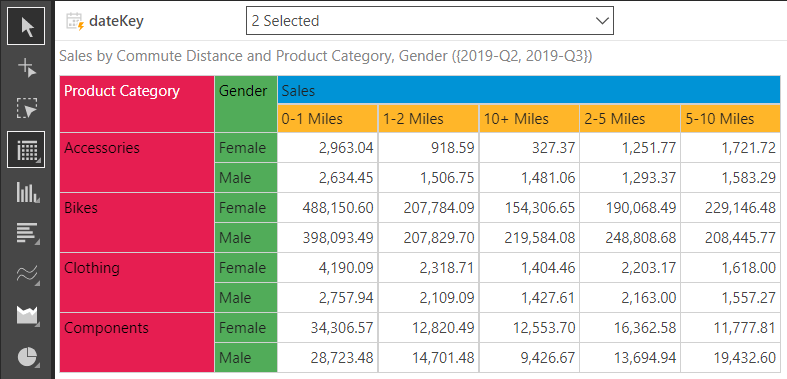
Mary now uses the calendar slicer to select two quarters, Q2 and Q3 for 2019. She selects the “simple” option, the “Quarters” granularity, and then the two quarters from the calendar slicer.
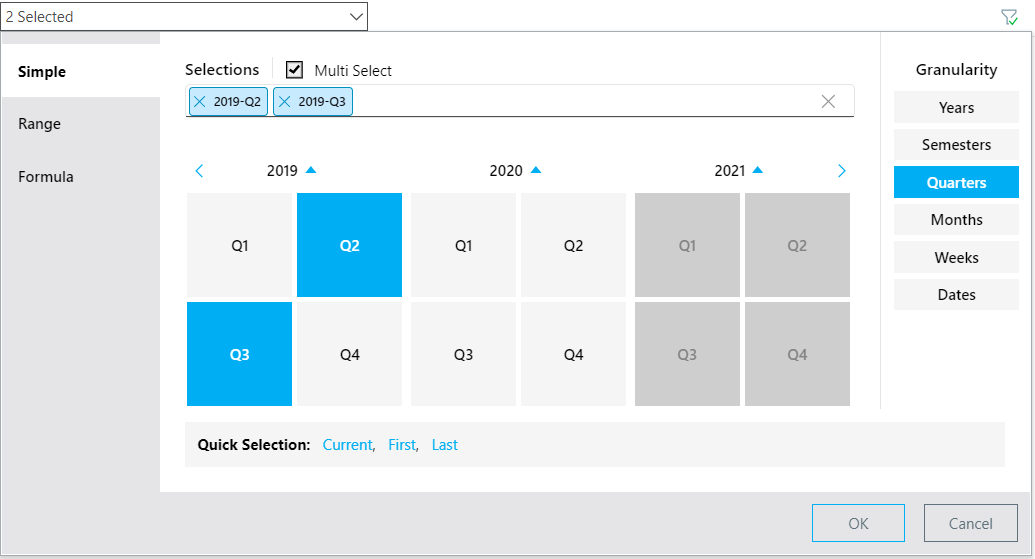
Once again, the results are displayed as per the selection of the second and third quarters of 2019, as can be seen in the breadcrumb at the top of the report.
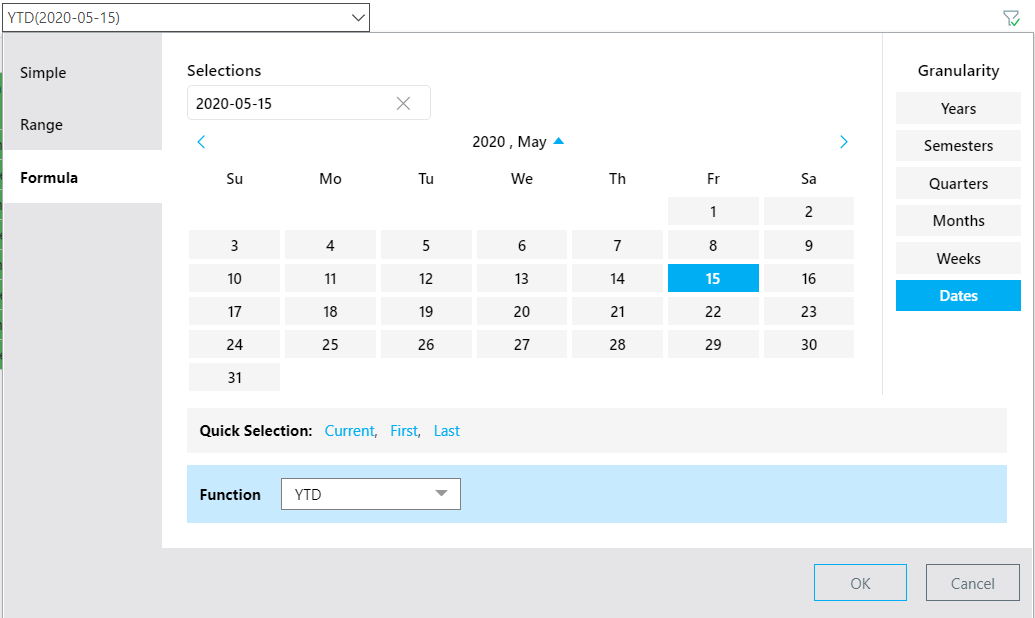
For this selection, Mary wants to view year-to-date sales until the 15th May 2020. She selects the “Formula” option from the left-hand selection options, selects the YTD function from the function option at the bottom of the slicer, and selects the desired date: the 15th May, 2020.
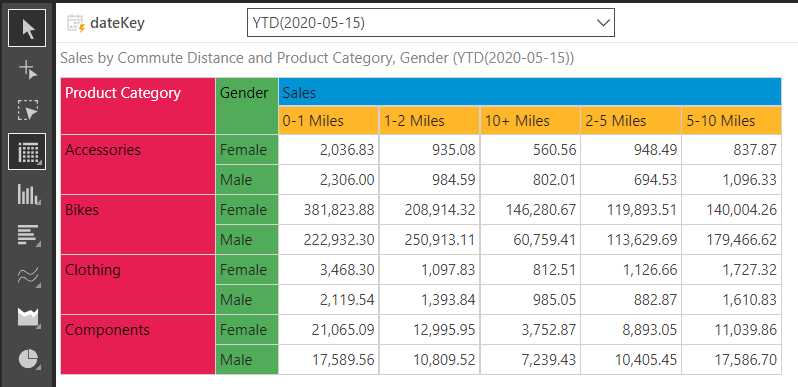
The results are displayed as per the selection of the year-to-date until 15th May, 2020, as can be seen in the breadcrumb at the top of the report.
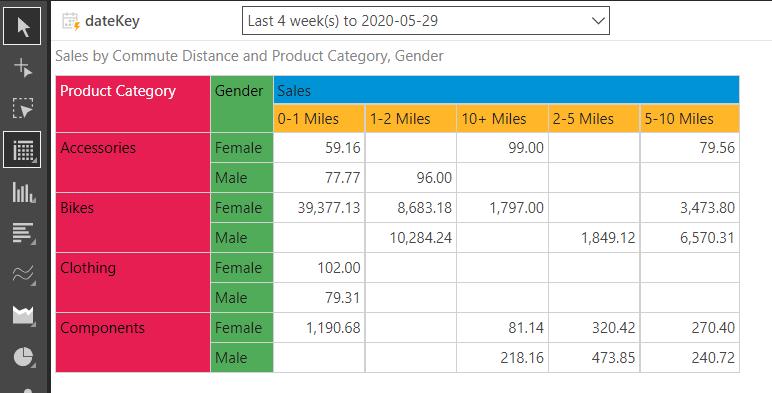
The formula calculation can powerfully select the last “n” number of days, weeks, months, or years using simple point-and-click functionality. In this example, Mary selects the Formula option, then selects the “Last” function. Within the “Last” function she then selects the weeks option, entering “4” as the number of weeks to display. Mary uses the 29th May as her “to date.”
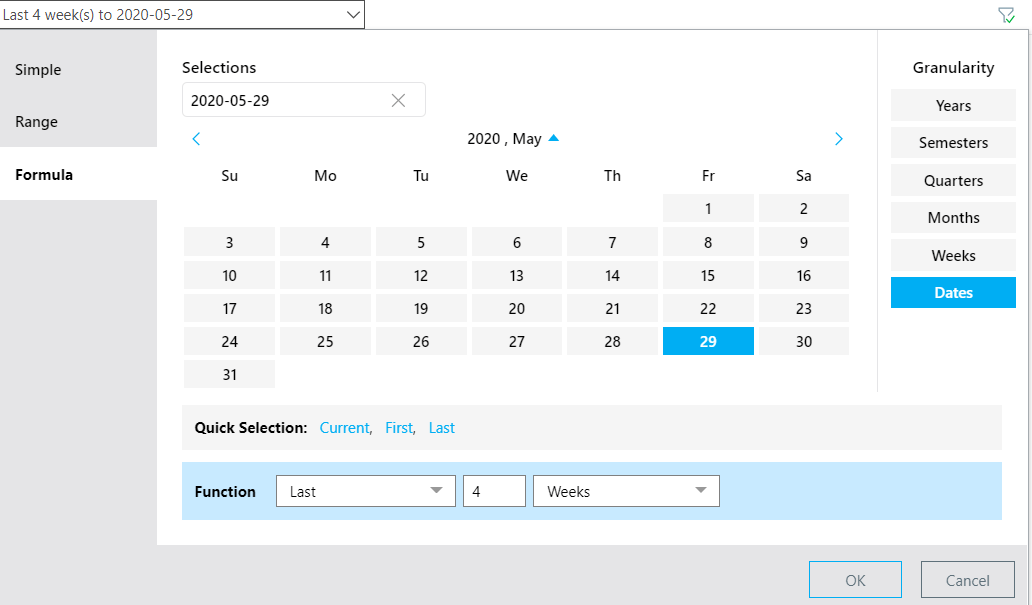
The results are displayed as per the selection of the last four weeks ending 29th May, 2020, as can be seen in the selection at the top of the report.
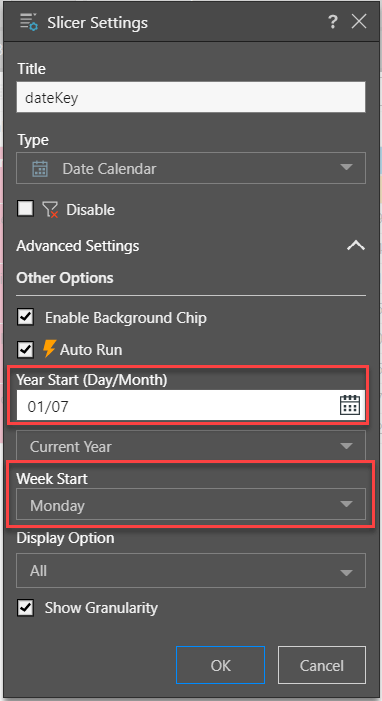
Pyramid provides users with the capability to define non-calendar periods that begin on dates other than January 1st. Users may also define the week start day. This flexibility enables users to customize the date function to suit their own country or company’s standards.
Pyramid’s smart Calendar Slicer is designed to make date-time operations fast and simple—on any data technology. Users without date-time structures in the original data source have to manipulate data in ETL operations or build and deploy complex calculations and competitive tools can’t deliver time-intelligence in a direct query model. Pyramid allow users to use smart date-time selections through an instantaneous point-and-click interface without changing the data source or ingesting the data into an intermediate database. It provides selections with different granularity settings, using simple, range, and formulaic selections, truly delivering sophisticated analytics simply.
Pyramid 2020.10 is chock full of powerful features like the calendar slicer and filter capabilities described above. For more detail about some of the other new headline features contained in the 2020.10 release, please see these additional write-ups:

How-To
SAP is essential enterprise software. Your organization has made significant investments in SAP. You've tailored…

How-To
Pyramid’s built-in multi-factor authentication (MFA) option adds a rock-solid layer of security to your BI…

How-To
Administrators occasionally need to check complicated settings and security structures for users. Sometimes the easiest…

How-To
Pyramid lets users customize and personalize the labels of value metrics and hierarchies for a…

How-To
Static data format masks, used to format values in analytics) is a standard feature in…

How-To
Pyramid lets users display multiple value metrics in a single report, each with its own…

How-To
Pyramid’s persistent color feature maintains the same color in all visualizations for selected data elements,…

How-To
Pyramid offers flexible, intuitive security for parent-child hierarchies, providing role-based control over how members are viewed…

How-To
Pyramid excels in its’ native support for parent-child hierarchies, automatically generating hierarchical structures and providing fluid,…