Building a dashboard to answer questions
Organizations – all organizations – are highly dependent on their information channels. Who is buying what? Where? When? Which departments are performing well? Which aren’t? Who’s been making money? Who’s been losing money? What’s the projection for next month? Next quarter? Next year? Obtaining and visualizing the answers to these questions (and many more like them), is key to rapid adaptation to dynamic market needs, smooth organizational functioning, and profitable business performance.
You can’t manage what you can’t measure
In order to allow the strategic vision to trickle-down to the end-performance level, the built dashboard must lay out quantifiable parameters, display key performance indicators, and track multiple goals.
To support these needs, here is a 5 step multi-layered strategy to help you build the BI dashboard, from backend to front, that your company needs:
- Quantify Objectives and create measurable performance indicators
- Scope and Analyze existing organizational data in order to decide which data is necessary to support the performance indicators
- Analyze Data Gaps and create repositories and access capabilities to missing data required to support performance indicators
- Provide an automated solution for defining, tracking, and analyzing performance, based on the defined objectives and performance indicators
- Visualize and enable end users to interact with the data in an intuitive, pervasive way.
Making sure your dashboard has the right functionalities
Dashboards allow visual integration of complex datasets, taken from an unlimited number of sources – all displayed in visually comprehensible and intuitive formats. The flexibility needed in the dashboard interface is one that allows users at various levels to view relevant cross-organizational content, and collaborate across departments, continents, and time-lines. Without need for coding or complex IT requests, your dashboard allows you to define and manipulate views into a wide variety of display and presentation formats.
Check out ours!
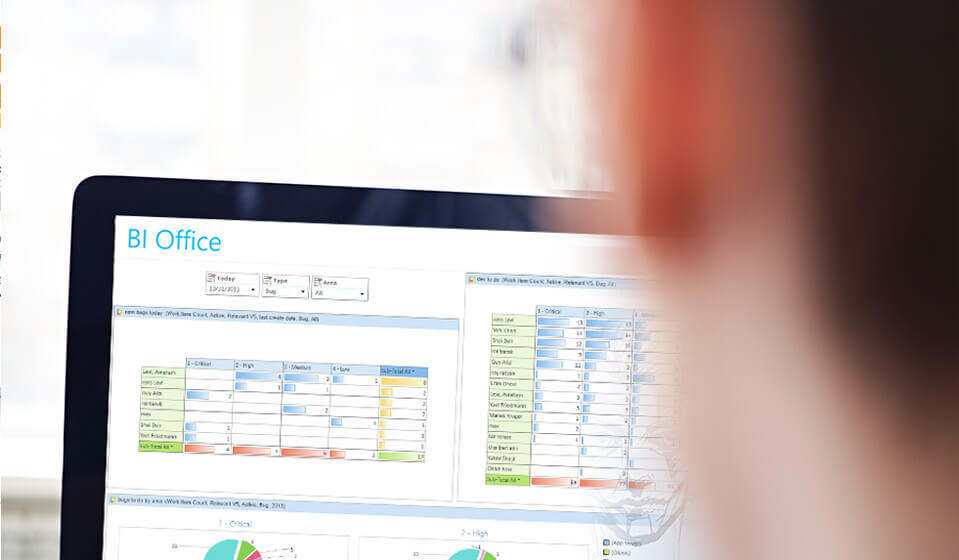
BI Office offers fully customizable and interactive dashboard solutions. BI Office Dashboards provides decision-makers of all levels with instant and comprehensive access to all relevant information, delivered in a rich visual format and can also be integrated into organizational portals and websites, offering smooth integration with existing systems and user interfaces.

