
- Solutions
-
-
Featured Solution
 Get more value from your existing SAP BW and SAP HANA investments with our SAP integrations.
-
-


Pyramid’s GenBI fuses generative AI and analytics to tap into your databases and provide reports at lightning speed.
Japanese businesses embrace Pyramid’s unified platform to replace fragmented tools and drive data-driven transformation.

Pyramid’s CEO Omri Kohl explains how GenBI completely revolutionizes the way business interact with data.

Business intelligence (BI) has long been regarded as the expertise of professionals who are knowledgeable in data analytics and have

Transform your data analytics with AI in 2024. Discover the future of insights and innovation today!

We're starting to see tools for AI-based "conversations" with data, further enabling discovery for business leaders Business intelligence (BI) is…

Omri Kohl is the CEO and co-founder of Pyramid Analytics. The Pyramid Decision Intelligence Platform delivers data-driven insights for anyone…

Generative business intelligence, or GenBI, is one of the big new excitements in the world of business optimization. It utilizes…

Thanks to the rise of AI, it’s getting easier to ask questions about your business data using your own words.
Generative AI, a subset of artificial intelligence, refers to algorithms and models that can generate new data, images, text, or…

Omri Kohl is the CEO of Pyramid Analytics, the business intelligence software platform that he cofounded in 2008. Earlier this…
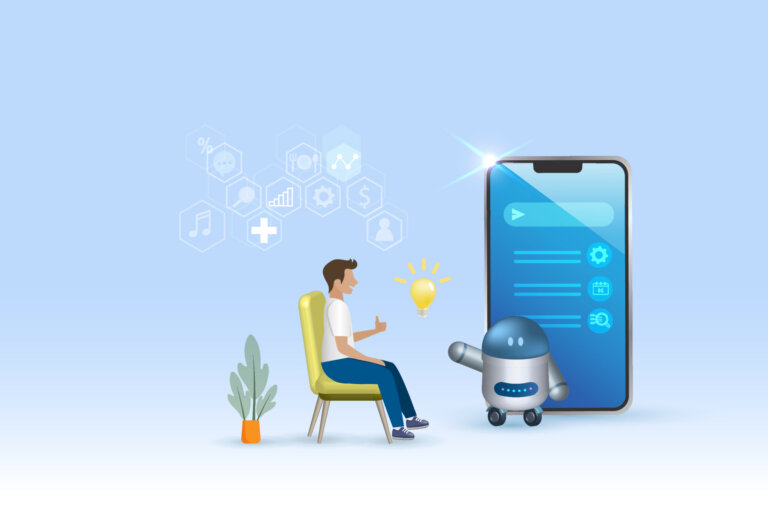
Discover how AI chatbots and natural language querying are revolutionizing data-driven insights, democratizing access to business intelligence, and easing the…

It's not only people who collaborate with each other within the working world. These days, generative AI and business analytics…

Leveraging GenBI can empower CIOs to unleash the potential of GenAI and Business Intelligence for their organization while keeping their…

Business leaders still value data insights, but now they are seen as a basic need for every company.

RAJABANDOT hadir sebagai platform hiburan digital yang menyediakan akses praktis untuk pengguna yang mencari layanan togel online Toto Macau, Slot88…
Data analytics is no longer a nice-to-have for businesses. With more organizations digitizing their operations, data-driven decision-making is becoming the

Over the past two years, artificial intelligence (AI) has been integrated into virtually all aspects of the business

Revolutionize your business strategy with the cutting-edge fusion of AI and BI, unlocking unparalleled insights and decision-making power! Discover how…

The continuing rise of generative artificial intelligence has the potential to transform the way people work in a myriad of…

With the help of AI, business leaders can detect and mitigate emerging risks, spot nascent opportunities and capitalize on them…