
- Solutions
-
-
Featured Solution
 Get more value from your existing SAP BW and SAP HANA investments with our SAP integrations.
-
-


2020.10 is the latest release from Pyramid Analytics. It extends the functionality introduced in our major 2020 release. This is one in a series of posts that highlights some of the major new features.
Pyramid provides users with a self-building and self-maintaining documentation mechanism for data and analytics. The “Data Catalog” helps analysts and administrators find the data or analytical assets they need. In the context of data alone, it serves as an inventory and description of data sources, ETL processes, calculations, and data targets. It can also be used to evaluate the fitness of the data artifacts for intended uses. In the context of analytics, the rich information on reports, dashboards, formulas, and business logic provides users with a catalog of analytical assets. The combination of the two presents a quantum leap in collective knowledge.
A single, central data catalog ensures a single version of the truth for all data definitions, formulas, reports, and all other data assets. Without it, chaos reigns, and data governance becomes extremely difficult to achieve. A decentralized data catalog increases confusion regarding which definition should be used, encourages duplication of definitions, and undermines the concept of “a single version of the truth.”
Some BI tools (such as Power BI and Tableau) encourage users to utilize desktop tools because it is easier to build and manipulate data. This, in turn, promotes the use of local definitions of data and artifacts, subverting the entire concept of data catalogs. Alternatively, many other BI tools (including Qlik and Sisense) only let users build analytical content in siloed projects. So even in a server deployment, the resulting catalogs are one-off, siloed definitions for data and formulae, reports, and dashboards.
Pyramid addresses data cataloging with a powerful approach based on its server-based architecture, shareable data models, centralized business logic, and reporting. A classic data catalog provides universal documentation on the data model, including data sources, targets, and the ETL process. Pyramid delivers this and expands the classic data catalog to include all analytical content as well.
Pyramid creates a self-building, self-maintained data catalog that interconnects the data elements and the analytical content elements in the system at all levels, all the time. It provides optional capabilities for users to add and adjust descriptions. Users can access the catalog in one of several ways:
The catalog details are exposed to the right users (based on security) at the right time—solving both the headache of sharing information and governance in one step.
As explained, there are two aspects to Pyramid’s data cataloging: the classic cataloging of the data model and the cataloging of the analytical content assets.
Because of Pyramid’s rich self-cataloging infrastructure, many other derived capabilities can be delivered:
Note: In Part 2 of this two-part data catalog blog, I will cover these items in more depth. I’ll explore how the data lineage, structure analyzer, and data source changer work and their effect on conjoining the intersection between the content and the data catalog.
Administrators can also derive extended functionality through the Pyramid’s cataloging framework:
Suzanne, a business analyst at XYZ Retail Inc., is using Pyramid to perform analytics on her ERP system housed in an Oracle data warehouse. As a new employee, she would like to better understand the relationships between the data sources and the ETL processes that have been performed. In addition, it will help her to view the current analytical assets, as well as the numerous formulas that have been created to accommodate useful calculations, so she will not have to “reinvent the wheel.”
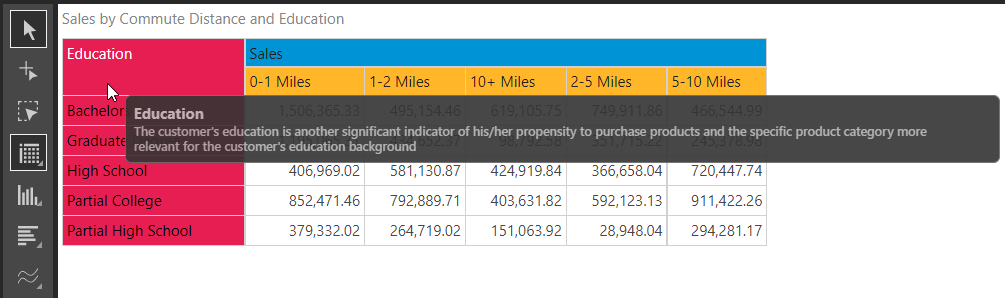
Suzanne wants to review the descriptions and details of all hierarchies and measures that are available from the current data catalog while creating or reviewing a report. The full description appears as a tooltip when hovering over the hierarchy or measure in a report. In this example, Suzanne hovers her cursor over the column heading for the “Education” hierarchy and the description is displayed as a tooltip.
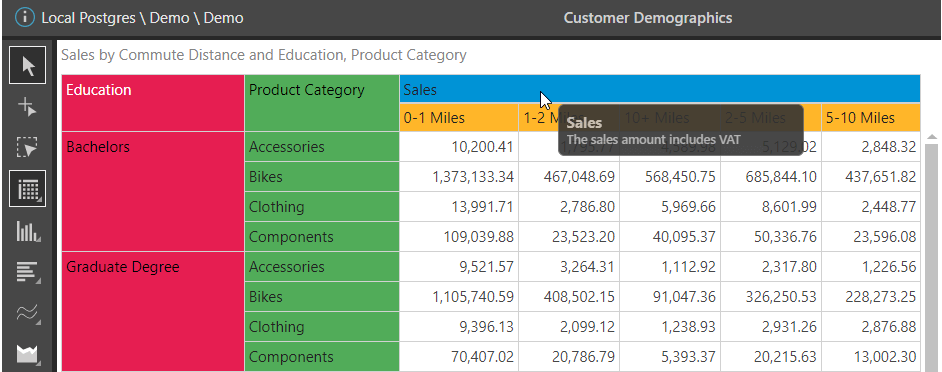
Measures also display descriptions as a tooltip when the cursor hovers over the measure heading in a report.
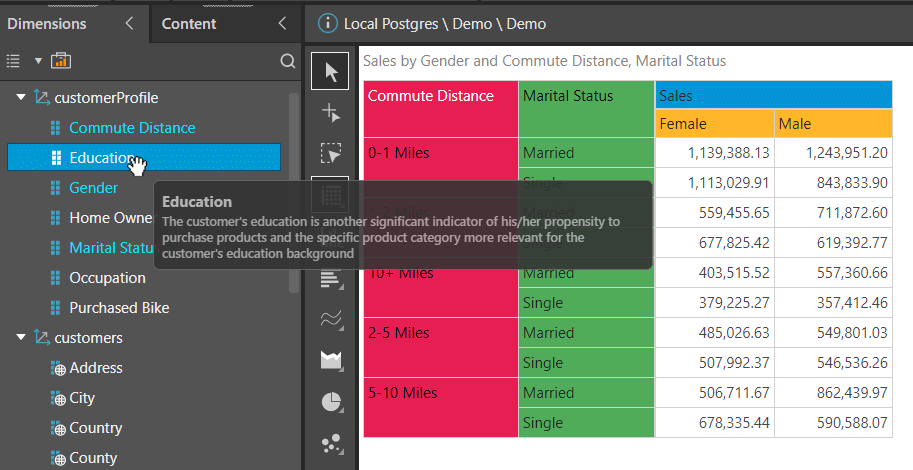
The tooltip is also available when hovering over the tree structure of the available hierarchies and measures. In this example, Suzanne hovers over the “Education” hierarchy to better understand its relevance in the data model.
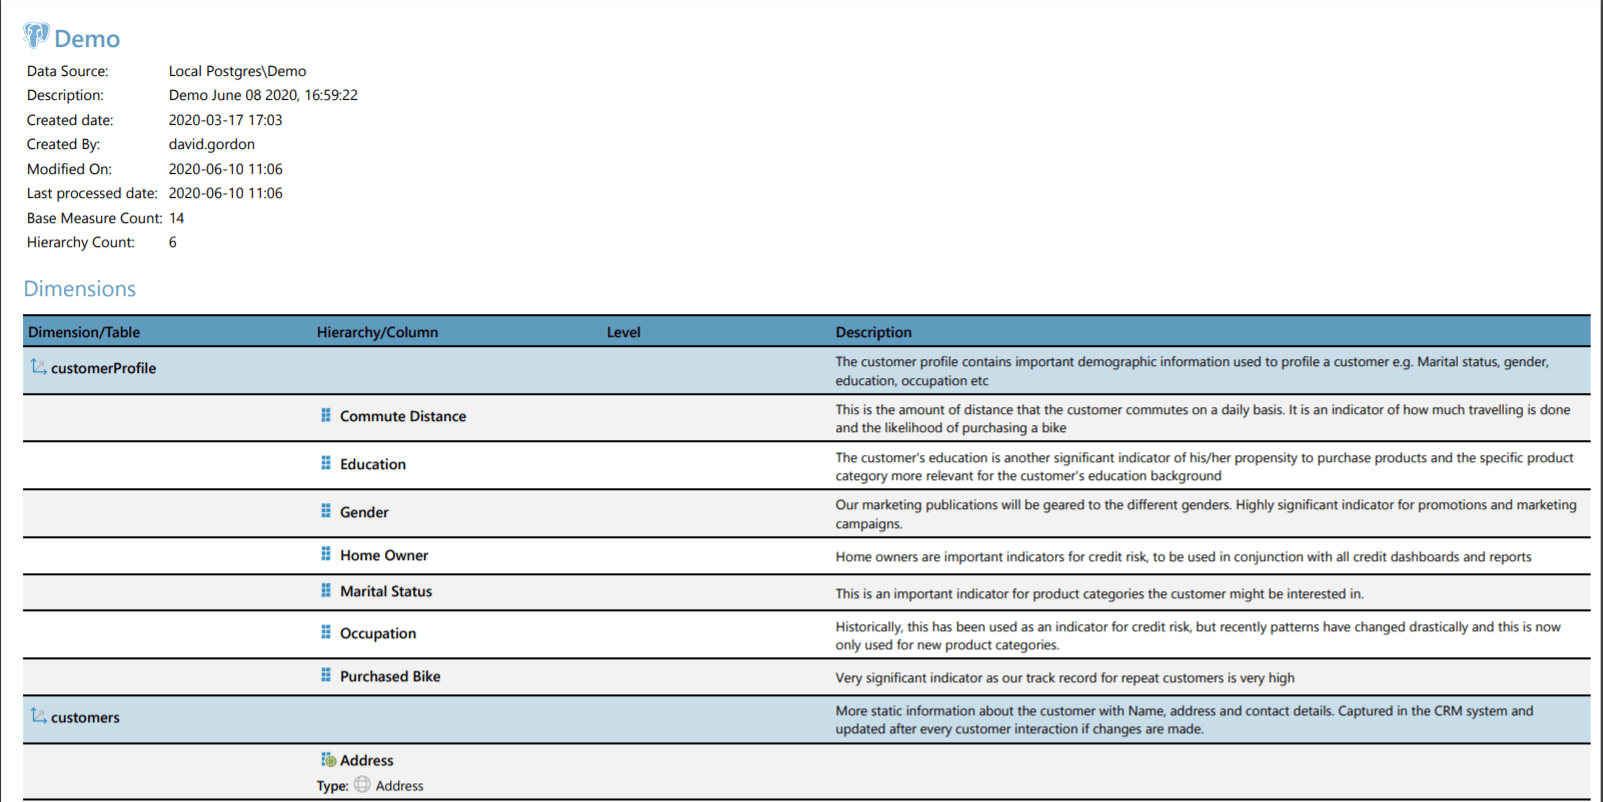
Next, Suzanne wants to export the descriptions and details of all hierarchies and measures that are available from the current data model while creating or reviewing a report. Suzanne simply clicks on the “Data Catalog Export” button.
An exported PDF file is then automatically downloaded, listing all the dimensions, hierarchies, levels, and measures, together with their relevant descriptions.
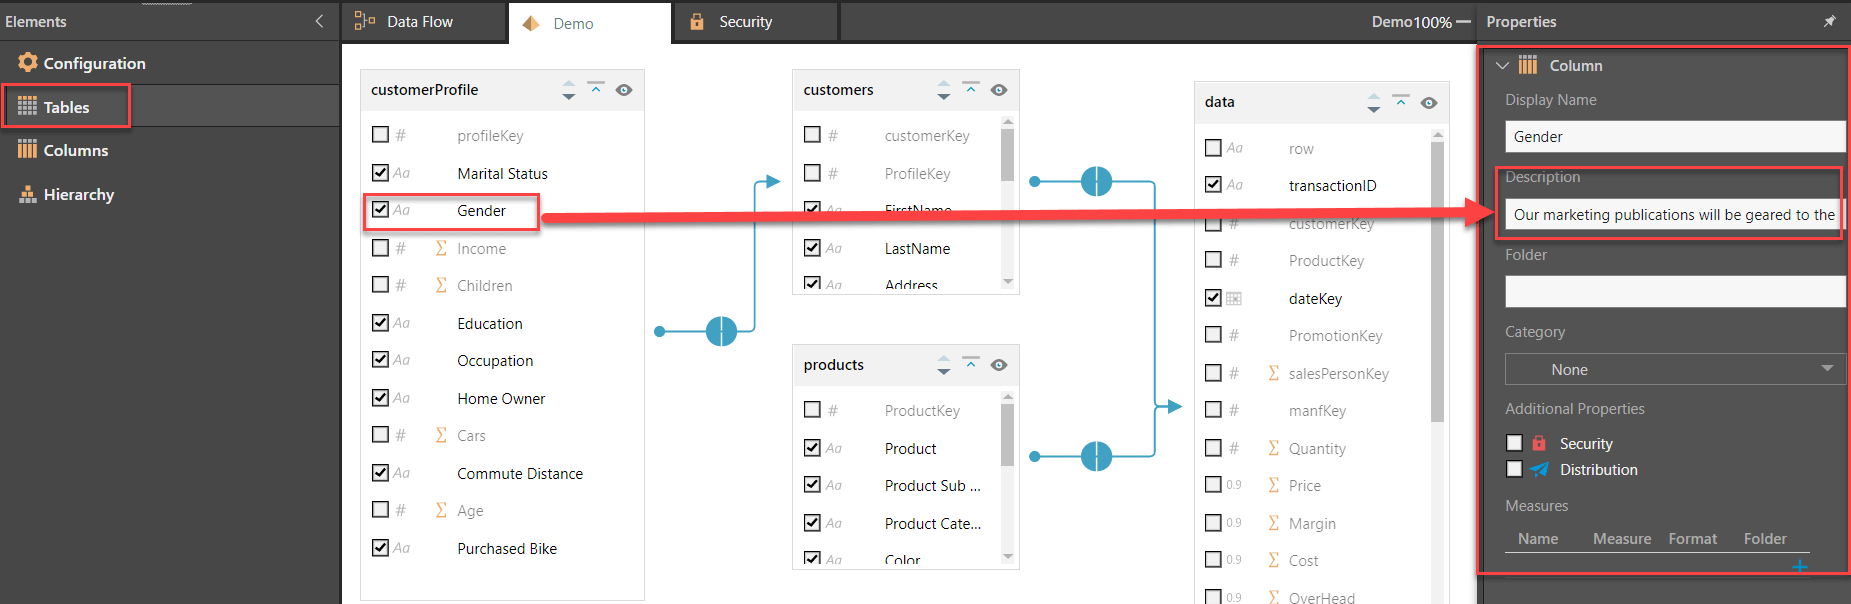
The descriptions can be set by the model designer when designing a Pyramid model. In this example, from within the data model, after selecting “Gender,” Suzanne can change the description that will subsequently appear in all tooltips when hovering over the column heading or tree structure.
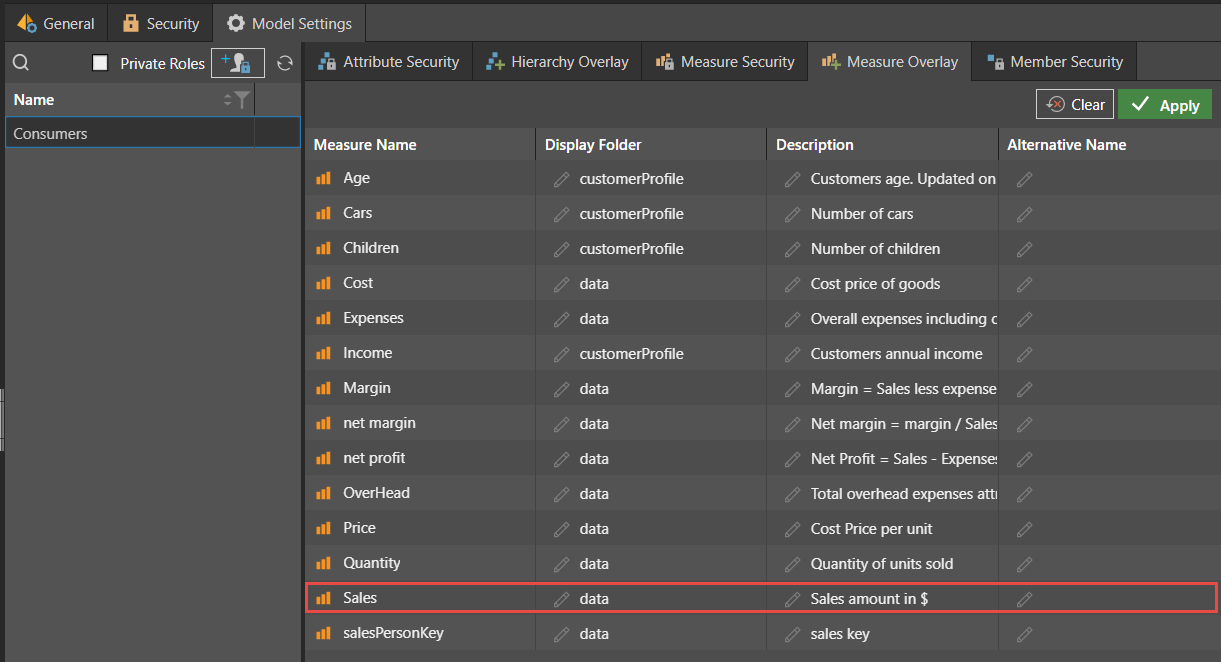
And finally, the accounting department wants to use the term “Revenue” instead of “Sales” on all reports. In the administrator’s source manager below, we see the default descriptions for all the measures viewed by all users. The “Sales” column has its own description that is displayed as a tooltip when hovering over the measure.
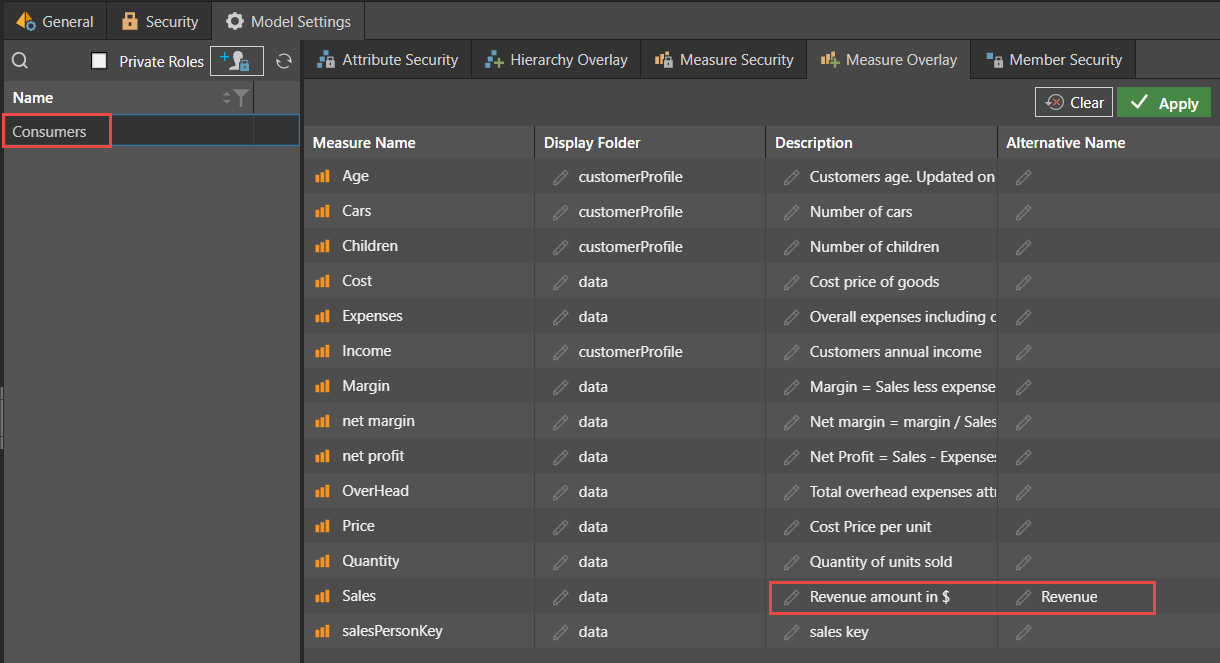
Admins can create overlays for the role used exclusively by the accounting department. The screen below illustrates how the Sales measure’s name and description have been modified exclusively for the user group “Consumers,” which is used by the accounting department.
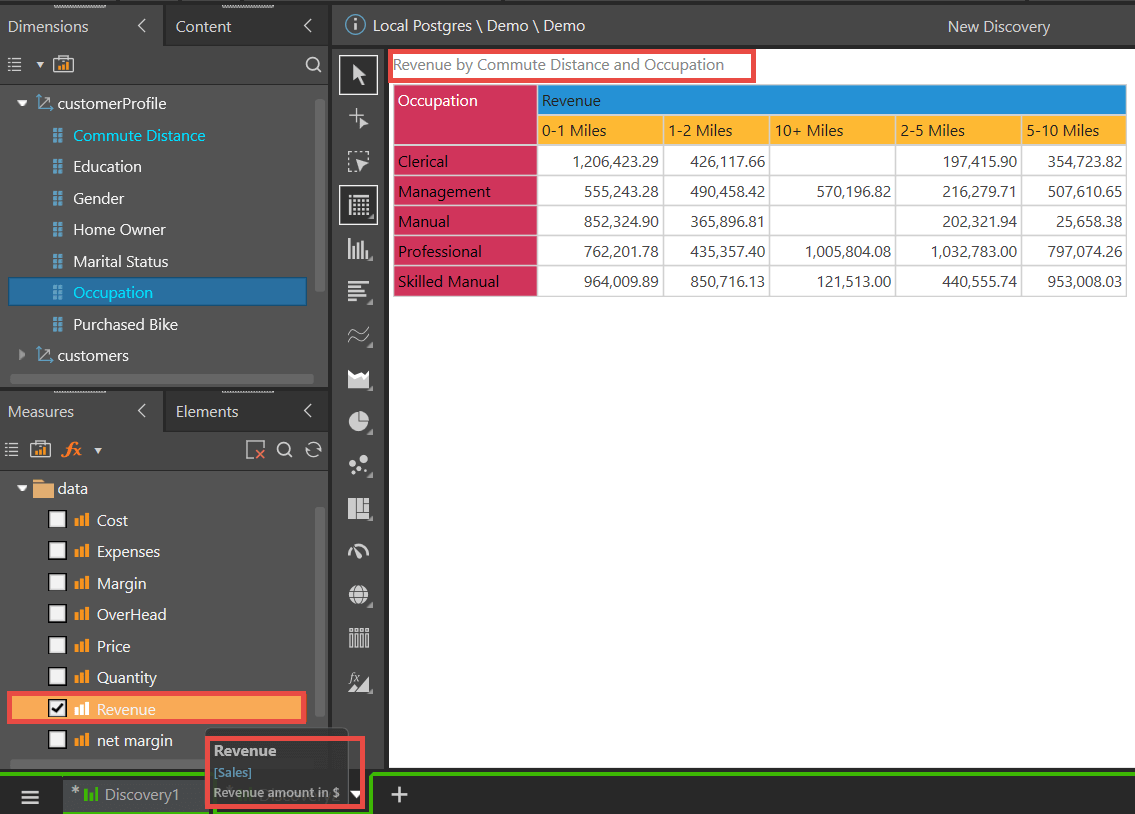
When a user from the accounting department accesses the report, the name and description that appears as a tooltip are automatically modified. Note how the term “Sales” has been replaced by the term Revenue on the measure, the tooltip, and even in the report heading.
Suzanne wins on both accounts: by (1) maintaining a central data catalog on the one hand, while (2) allowing a customizable solution within a controlled environment—without requiring duplication of definitions and sowing confusion.
Pyramid provides a self-building and self-maintaining data catalog engine to assist users in viewing the data catalog for their data models and analytical assets.
The Pyramid approach stands in strong contrast to desktop-based analytical tools or tools that encourage the use of siloed data and analytical projects which cannot build or utilize centralized data cataloging functions accessible by all authorized users in a common, consistent, and cohesive manner.
The server-based architecture of Pyramid provides an ideal platform for sharing data model details. It expedites the use of powerful tools to make changes to data sources, while quickly and easily rectifying resultant errors. Users can access the catalog through browsing the data catalog exporter content explorer; using extensive search options; utilizing user recommendations; or via an ML-driven suggestion listing. This provides a feature-rich, user-friendly interface to help users manage their data assets. Administratively, the data catalog can be “overlayed” by user or role, providing customized alternative views, while retaining a centralized, single data definition.
Pyramid 2020.10 is chock full of powerful features like the data cataloging capabilities described above. For more detail about some of the other new headline features contained in the 2020.10 release, please see these additional write-ups:

How-To
SAP is essential enterprise software. Your organization has made significant investments in SAP. You've tailored…

How-To
Pyramid’s built-in multi-factor authentication (MFA) option adds a rock-solid layer of security to your BI…

How-To
Administrators occasionally need to check complicated settings and security structures for users. Sometimes the easiest…

How-To
Pyramid lets users customize and personalize the labels of value metrics and hierarchies for a…
How-To
Static data format masks, used to format values in analytics) is a standard feature in…
How-To
Pyramid lets users display multiple value metrics in a single report, each with its own…

How-To
Pyramid’s persistent color feature maintains the same color in all visualizations for selected data elements,…
How-To
Pyramid offers flexible, intuitive security for parent-child hierarchies, providing role-based control over how members are viewed…
How-To
Pyramid excels in its’ native support for parent-child hierarchies, automatically generating hierarchical structures and providing fluid,…