
- Solutions
-
-
Featured Solution
 Get more value from your existing SAP BW and SAP HANA investments with our SAP integrations.
-
-


BI Analysts are faced with daily challenges converting data into knowledge. It is the BI team’s role to integrate, analyze and then report or publish the findings that can, among others, identify opportunities and trends or find reasons for potential loss.
The ability to access and utilize data from the whole business is crucial to being able to adeptly integrate this information into a BI report. Being able to access the data is a good start, but providing business answers usually involves applying business rules and logic on top of the raw numbers. Without the proper tools, an analyst would need to have a deep knowledge of MDX or SQL to do it – and the more complex the business logic is the more technical knowledge is involved.
Another challenge quickly arises when you create new calculations. How do you share them with others? How do you centrally control them? Usually, analysts have to either circle around spreadsheets (version hell) or have to wait for IT’s iterations applying the calculation back in the cube or the database.
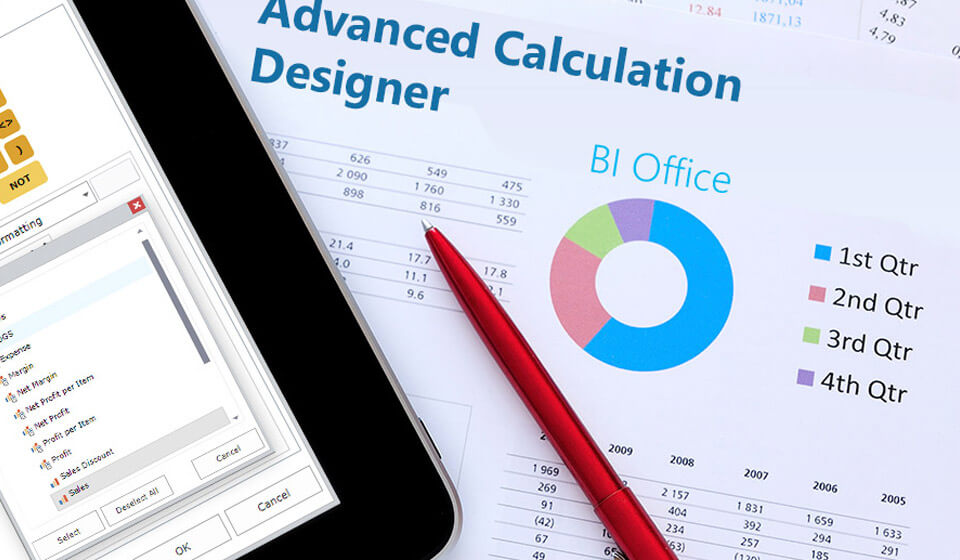
Pyramid Analytics has a built-in tool that allows analysts AND business users to easily build and share complex calculations with a point-and-click interface. Cross-dimensional calculation at your fingertips! This tool is called the Advanced Calculation Designer (ACD) , and it is an integral part of the Data Discovery tool. Once you have conceptualized how the calculation needs to work, you can easily and simply find the data sets and functions, and build them into the calculation. The integrity of the data is maintained as the application pulls the most updated data from the server (and can be refreshed). An analyst, or any business user, can use this tool to create any and all desired calculations.
The calculations are centrally managed – so you can share them exactly with the people you need to, and deploy department or organization wide when they are ready and business verified.
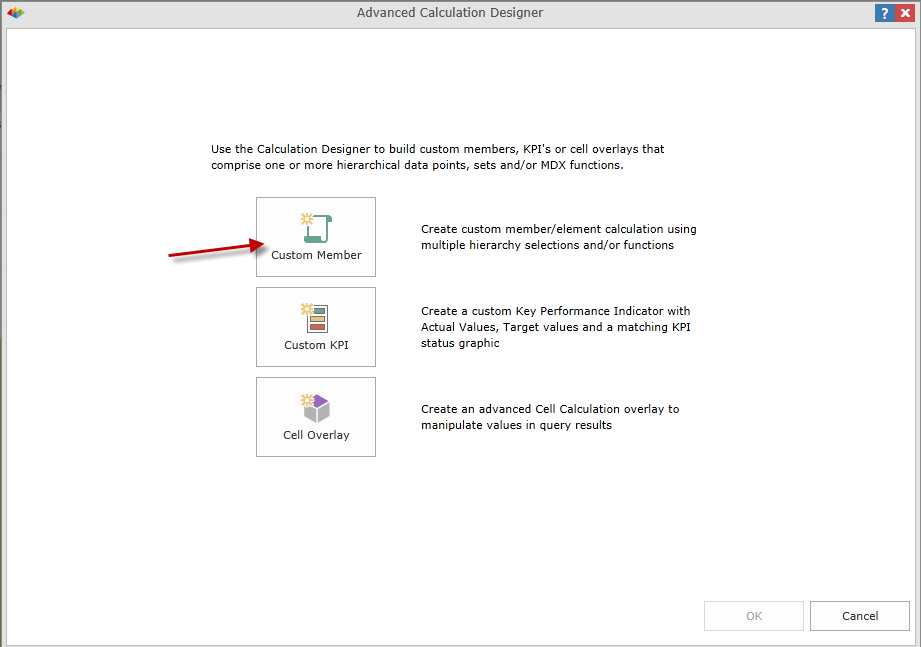
The ACD offers three different types of calculations: Custom Member calculation, Key Performance Indicator (KPI), and Cell Overlay.
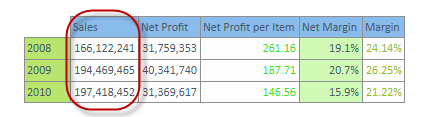
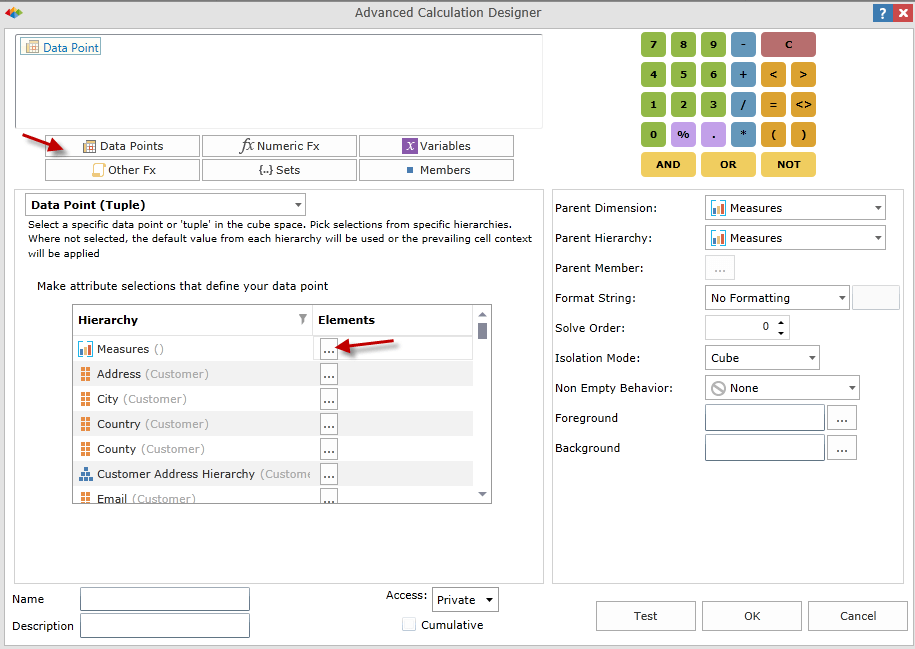
Building a Custom Calculation is a short, few step process in which you select a data set or data point and apply sophisticated numeric functions and mathematical operators to it. You can build a calculation as complex as desired with as many tuples, functions, member sets, etc. as needed. You can also use a variable (that can be created in the Variables Wizard to achieve a more dynamic calculation. This way, you are able to manipulate your analytics to explore and dissect the data in every permutation imaginable.
The ACD contains several more useful capabilities, such as:
In defining a KPI, you are creating a sophisticated scorecard that can compare double metrics in an iconic or gauge display. You have the ability to not only design the calculation, but select its visual properties and color banding from multiple visualization options.
The Cell Overlay functionality enables you to define cell-level calculations which can affect any cell that you determine. You can manipulate the value of cells with alternative values to achieve a particular analytic outcome. With the Cell Overlays functionality, you can run the “What if” scenarios as well as set custom aggregations (which means that you can set a parent to the value of the last child element, rather than the sum of its child elements), etc.
The ACD does not require you to create long algorithms and complex MDX scripts, although you do still have the ability to add them in if you want.
The level of control and specificity in this tool is unparalleled – and empowers all analysts and business users to present a highly focused picture that provides results that span the entire spectrum of the business data.

How-To
SAP is essential enterprise software. Your organization has made significant investments in SAP. You've tailored…

How-To
Pyramid’s built-in multi-factor authentication (MFA) option adds a rock-solid layer of security to your BI…

How-To
Administrators occasionally need to check complicated settings and security structures for users. Sometimes the easiest…

How-To
Pyramid lets users customize and personalize the labels of value metrics and hierarchies for a…
How-To
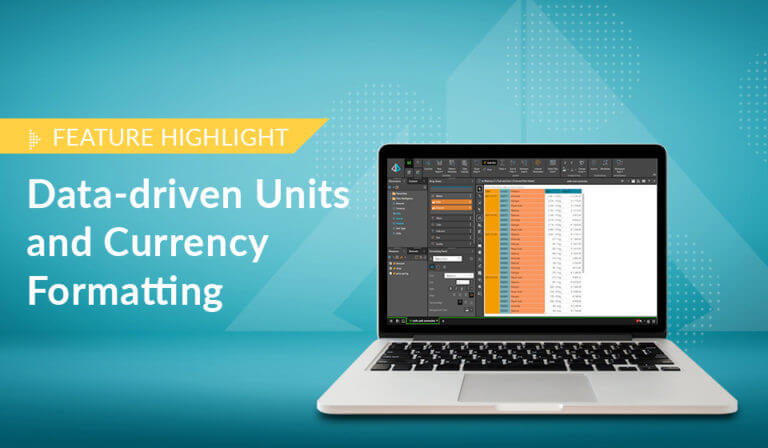
Static data format masks, used to format values in analytics) is a standard feature in…
How-To
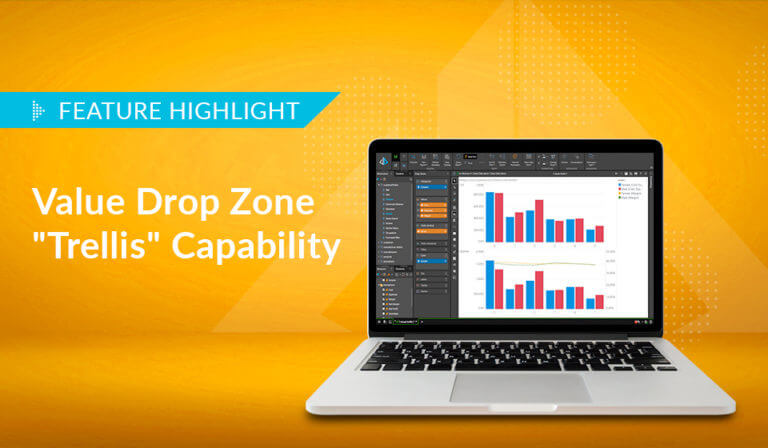
Pyramid lets users display multiple value metrics in a single report, each with its own…
How-To
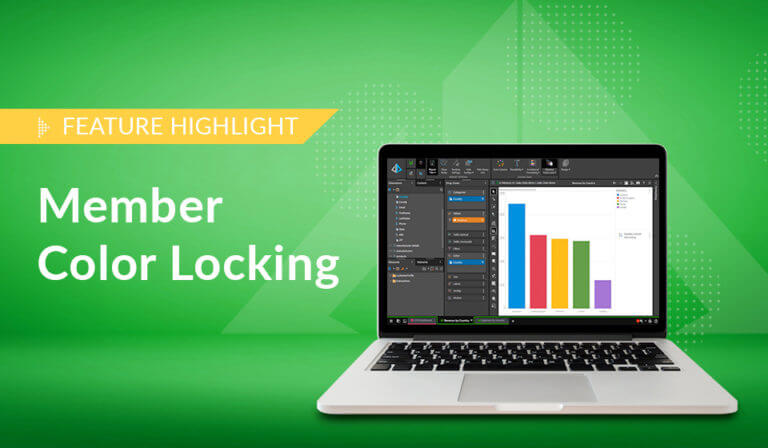
Pyramid’s persistent color feature maintains the same color in all visualizations for selected data elements,…
How-To
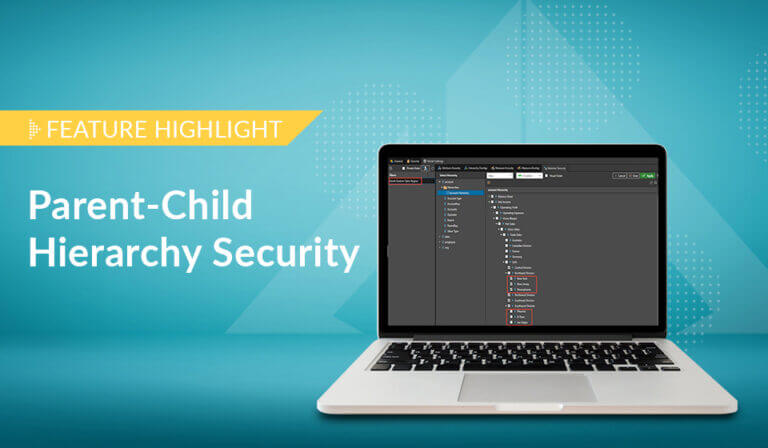
Pyramid offers flexible, intuitive security for parent-child hierarchies, providing role-based control over how members are viewed…
How-To
Pyramid excels in its’ native support for parent-child hierarchies, automatically generating hierarchical structures and providing fluid,…