
- Solutions
-
-
Featured Solution
 Get more value from your existing SAP BW and SAP HANA investments with our SAP integrations.
-
-


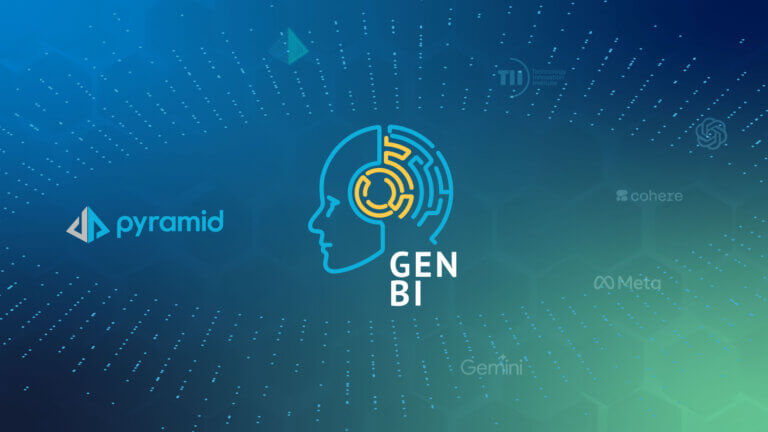
Pyramid’s GenBI fuses generative AI and analytics to tap into your databases and provide reports at lightning speed.

Japanese businesses embrace Pyramid’s unified platform to replace fragmented tools and drive data-driven transformation.

Pyramid’s CEO Omri Kohl explains how GenBI completely revolutionizes the way business interact with data.

5 methods for trouble-free embedded analytics projects - Developer Tech News

Within his prior startup, Avi and his co-founders built out a way to make intelligent decisions for their business using…

AI is becoming the engine behind the analytics value chain. Check out how, why, and action steps to move faster,…
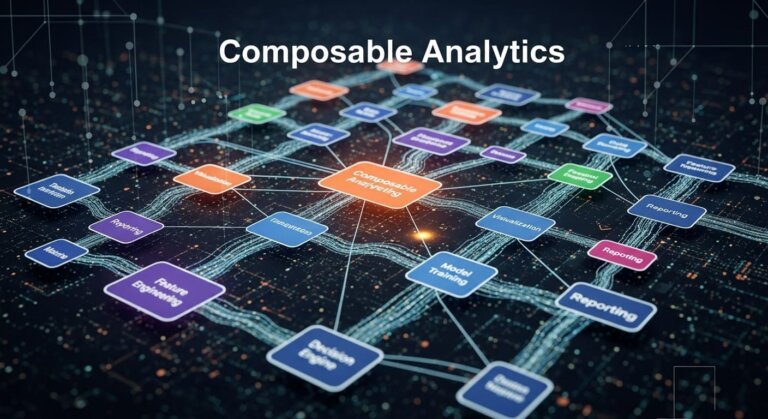
Build your perfect data stack: How composable analytics gives data teams the agility to adapt and win.
Most business apps capture data. They track orders, tickets, leads, expenses, tasks, or deliveries. But when someone needs insights, they…

Nowadays, enterprise data strategy is focused on turning constantly changing, multi-source data into decisions that move revenue, risk, and customer

Analytics strategies will be judged by how reliably and quickly businesses are enabled to take the next step.
Embedded analytics powers data experiences inside the tools we use every day. Dashboards and visualizations are placed directly within these…

Generative AI is transforming business intelligence by enabling secure, data-driven decision-making at scale.

Learn how Pyramid Analytics creates enhanced workflows by combining data prep, analytics, data science, and insights in one platform.

GUEST OPINION: Data analytics has emerged as a leading use case for AI in the business setting. Research shows that…
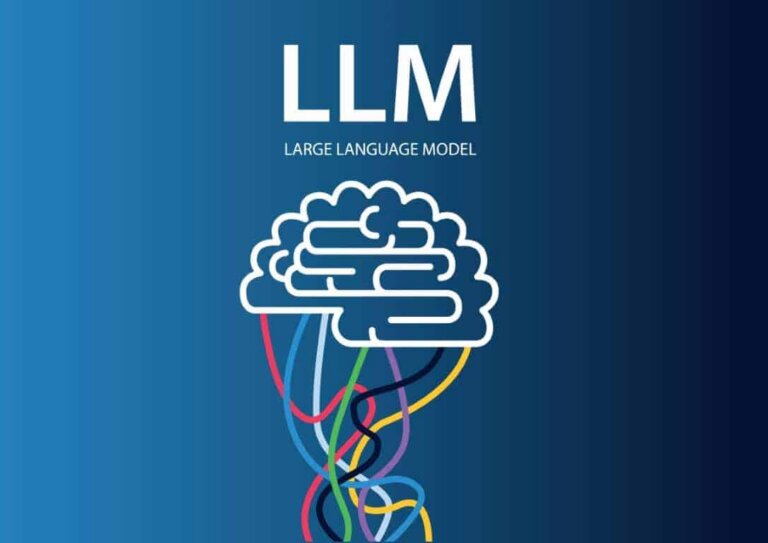
Discover the significance of specialized LLMs as we move beyond giant language models in artificial intelligence.

Generative AI's integration with business intelligence is allowing unprecedented self-service access to data-driven decision making. By eliminating the

As AI adoption rises across industries and business use cases, one of the most important implementations remains business intelligence. I’m…

The AI industry is careening headlong towards a huge shakeout that’s going to separate the haves from the have-nots and…

Embedded analytics implementations deliver in-context insights within everyday tools—while introducing integration, governance, and performance challenges for developers.

Pyramid Analytics Fuels ServiceNow’s Business Automation Ambitions
Pyramid Analytics provides an AI-driven, unified Decision Intelligence Platform that enables organizations to instantly prepare, model, and analyze data from…