

- Solutions
-
-
Featured Solution
 Get more value from your existing SAP BW and SAP HANA investments with our SAP integrations.
-
-


Pyramid’s GenBI fuses generative AI and analytics to tap into your databases and provide reports at lightning speed.

Japanese businesses embrace Pyramid’s unified platform to replace fragmented tools and drive data-driven transformation.

Pyramid’s CEO Omri Kohl explains how GenBI completely revolutionizes the way business interact with data.
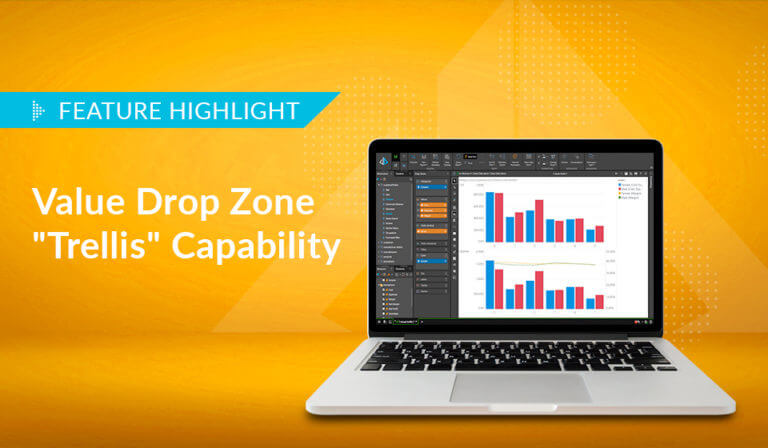
Pyramid lets users display multiple value metrics in a single report, each with its own graphical visualization, providing greater flexibility…
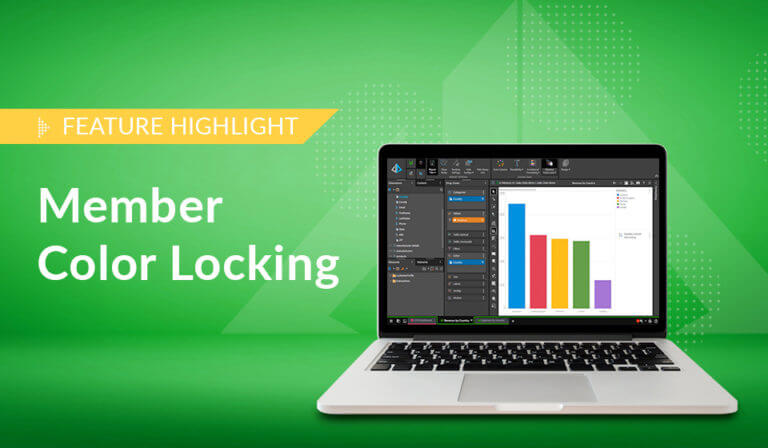
Pyramid’s persistent color feature maintains the same color in all visualizations for selected data elements, even after slicing or removing…
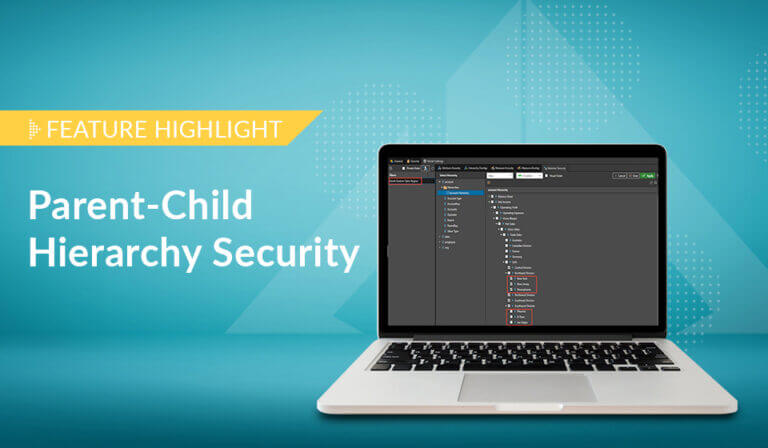
Pyramid offers flexible, intuitive security for parent-child hierarchies, providing role-based control over how members are viewed and aggregated within hierarchies. Implementing parent-child…
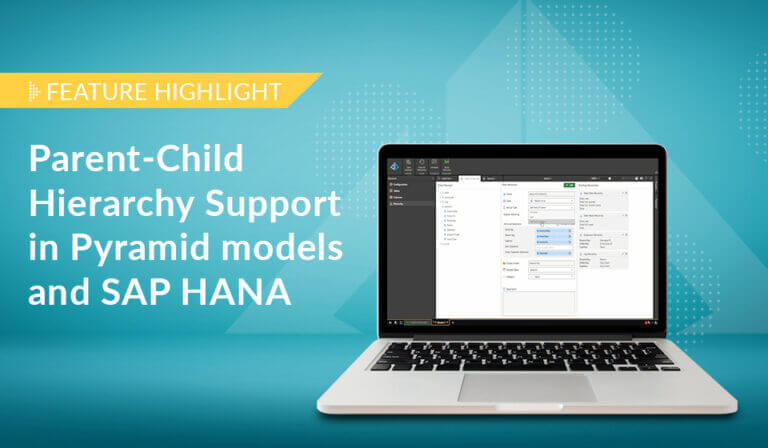
Pyramid excels in its’ native support for parent-child hierarchies, automatically generating hierarchical structures and providing fluid, intuitive reporting. Parent-child hierarchies are…
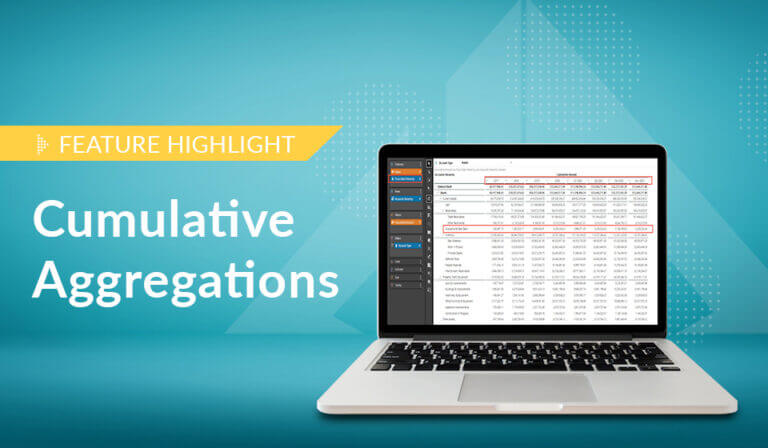
Pyramid provides time-based cumulative measures as a method for aggregating non-additive values on a cumulative basis in a data model,…
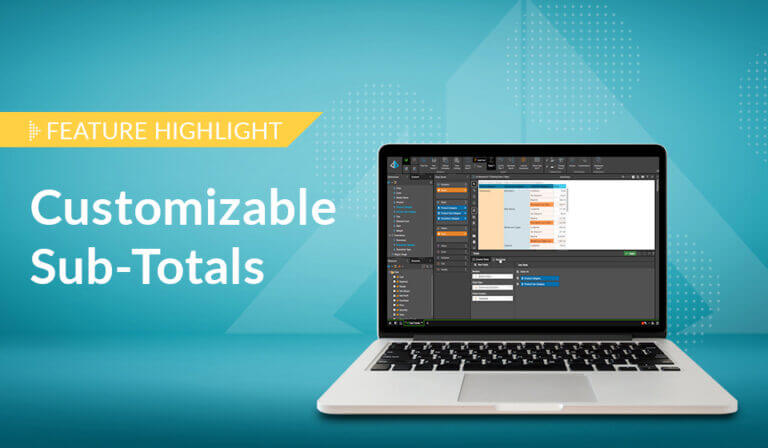
Pyramid provides users flexibility over how to apply subtotals in a multi-dimensional matrix grid—using a simple point and click interface. Adding subtotals…
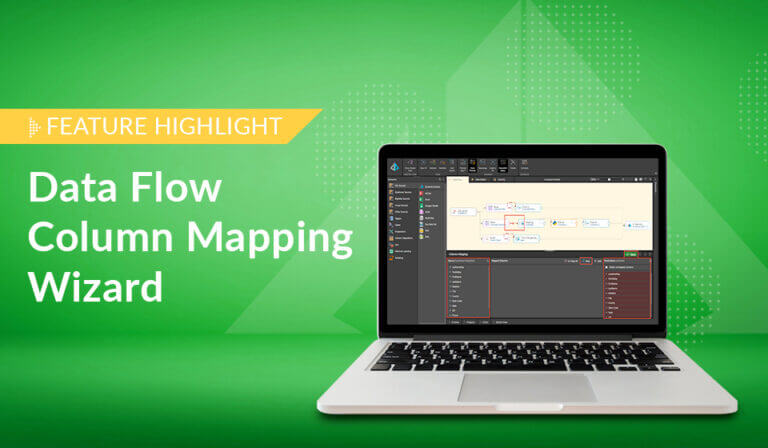
Data modeling is now central to all business analytic processes as companies embrace the “Decision Intelligence” paradigm. Delivering advanced data…
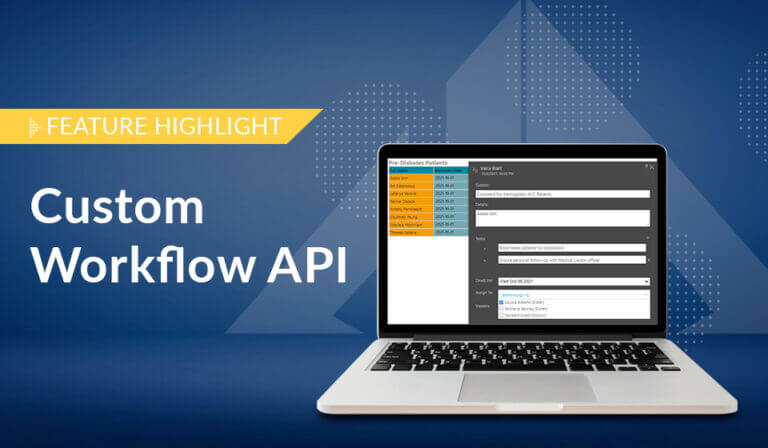
Pyramid’s Custom Workflows provides users with new collaborative options from within the analytics platform for delivering actionable analytics that go…
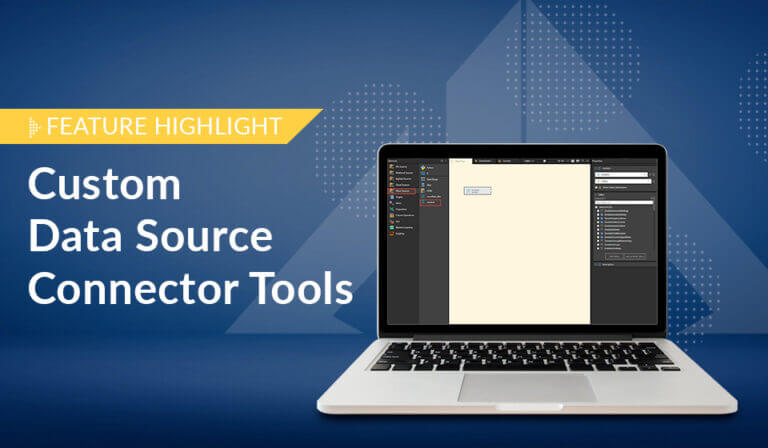
Pyramid provides administrators the ability to self-configure connectors for almost any JDBC data source, providing users access to these data…
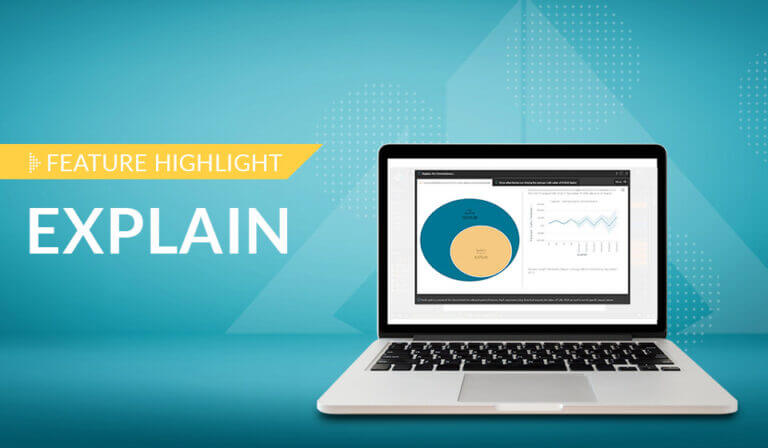
Pyramid’s “Explain” feature performs automated analysis directly against any data source in a single, on-demand click.

Decision intelligence is an evolving approach to data analytics to support business decisions of all kinds.

Even today, enterprise companies are choosing a limited, “departmental” approach to business intelligence (BI) strategy and adoption. They resort to…

A successful digital transformation must take hold and endure, and the transformation must drive real, measurable results.

A business decision supply chain contains a sequence of processes through which data owners (producers) can transform raw data into…

Customer success is the key to our own success. We strive to help our customers achieve their data-driven goals.

A business decision supply chain contains a sequence of processes through which data owners (producers) can transform raw data into…
Throughout its nearly 50-year history, SAP has risen to become one of the world’s most exceptional suites of software for…
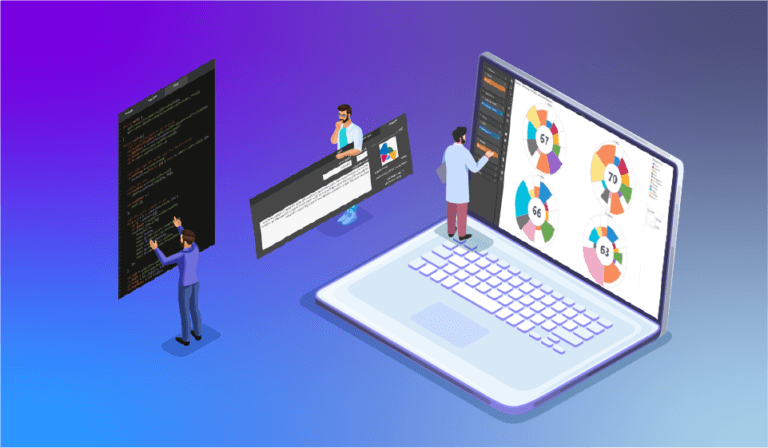
While Pyramid includes over 50 core visuals out-of-the-box (that can be extended to over 200 variations), it also offers the…