
- Solutions
-
-
Featured Solution
 Get more value from your existing SAP BW and SAP HANA investments with our SAP integrations.
-
-


In the good old days, it was OK if things took a little more time. Social media didn’t exist. The news came out twice daily—first in the morning paper and then on the evening broadcast.
Companies weren’t buried in information. IT didn’t have to deliver curated data to analysts at a moment’s notice, and reports didn’t have to be prepared at the drop of a hat.
Oh, how things have changed. Our world operates at light speed. Traditional news outlets—pushed to the limits by social media—have become micro cyclical. Businesses must perpetually analyze huge volumes of data; they can no longer afford to wait for monthly reports to tell them what to do next.
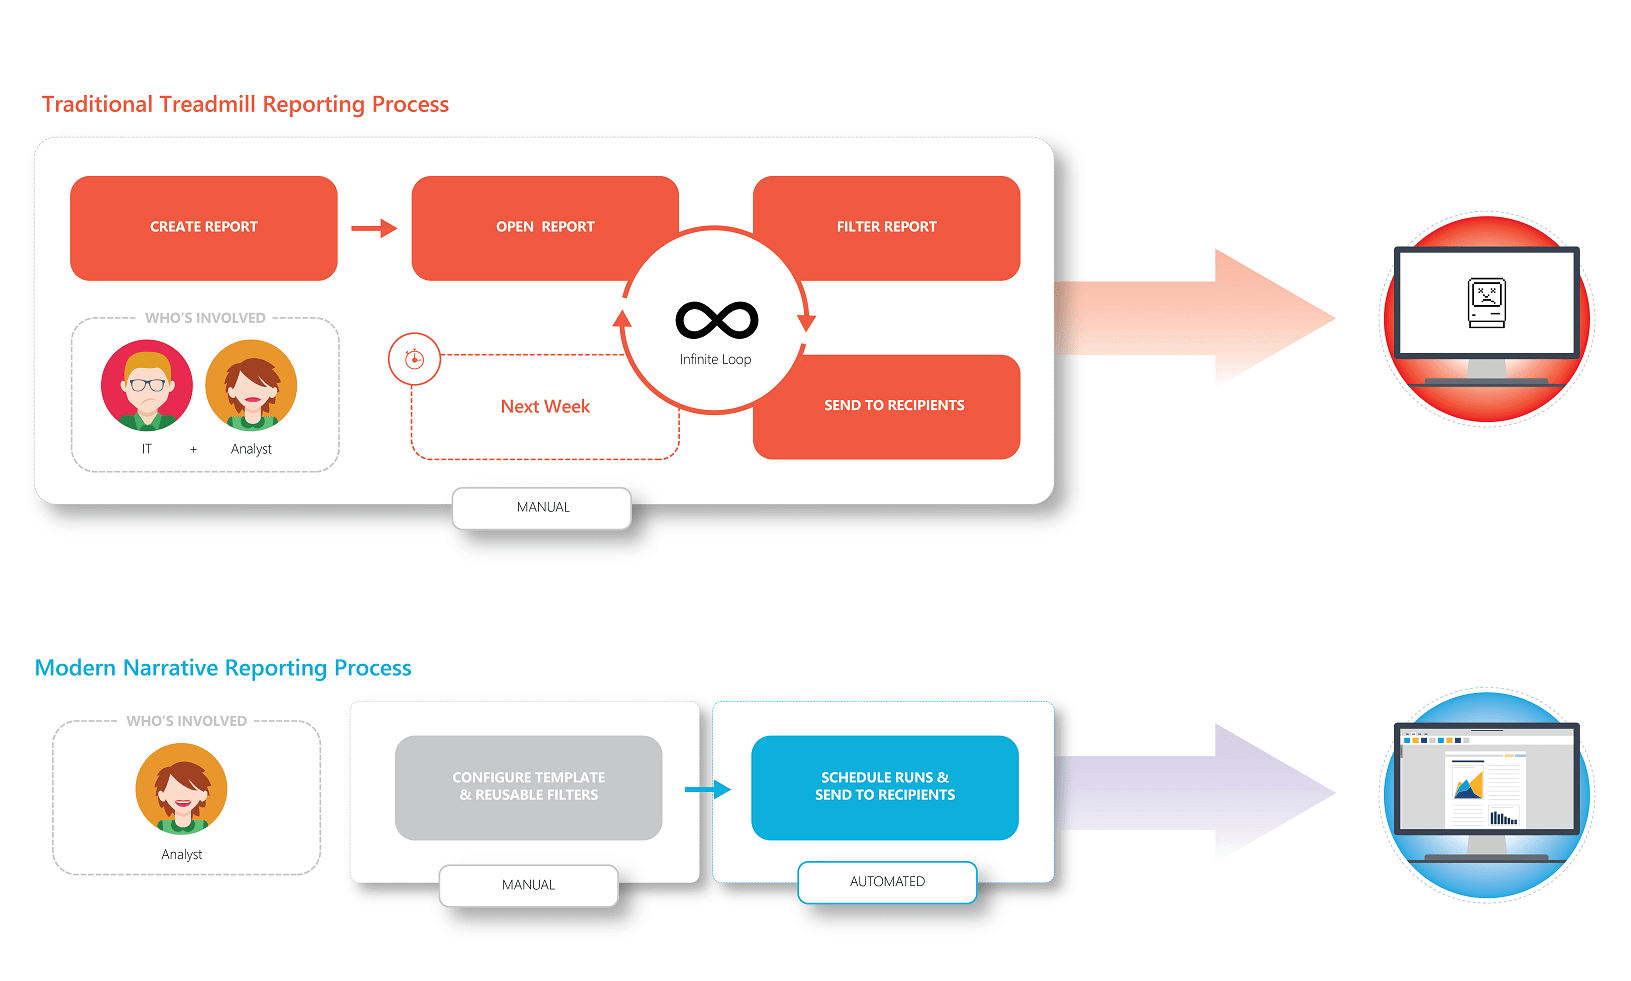
While organizations throw numerous cross-department teams at BI programs or embark on yet another technology initiative to generate faster insights, reports never seem to keep up. They’re bland, formulaic, and provide little actual decision-making value.
Why does analytic reporting always seem to fall short of expectations? There are two contributing factors:
It is possible to create reports that can help drive business value. The key is to use a business intelligence solution that includes self-service narrative reporting—reporting that provides deep data-driven context beyond the static data views and visualizations found in traditional reporting—as a core part of the analytic decision lifecycle.
Many BI solutions on the market today do not provide suitable reporting toolsets required for narrative reporting. Across the BI spectrum, analytics software makes it either too difficult to publish sophisticated analysis in reports, or the publishing tools are so rudimentary that the resulting content only provides shallow context.
Traditional BI tools may permit users to publish reports that contain KPIs and data visualizations, but they often require power user skill sets or assistance from IT. In contrast, self-service BI providers make it easier for non-technical staff to use, but they prioritize data visualizations in dashboard-style reports and limit or exclude true publishing functionality. While attractive, these visualization-based reports lack true analytic depth and don’t allow users to provide descriptive text that contextualizes the analysis. Plus, they don’t fill the need for published reports demanded by decision-makers, executives, and board members.
Other bleeding-edge BI solutions promote machine learning and automation as part of the reporting process. But organizations should be cautious not to rely wholly on automated tools to do analytic tasks more suited to subject matter experts using intuitive reporting and publishing tools. While automated tools might be capable of effortlessly generating pages of text, they can’t deliver the nuanced, razor-sharp—and relatable—content that can communicate vital insights.
Pyramid Analytics offers the only product on the market that gives analysts the ability to create and distribute published reports that contain the right balance of content. They can conduct analytic research, create compelling visuals, and then embed that content in published reports that contain information curated precisely for their audiences and are shareable in a variety of formats.
Reports created using Pyramid Analytics contain richer analyses that can feature a wide range of contextual elements that adapt to specific data configurations. So not only are the visualizations and grids data-driven, the commentary itself is data-driven. For example, end users can add slicers to their reports to filter and display pertinent data depending on the condition or audience. In addition, they can configure Pyramid Analytics to display conditional commentary that shows or hides entire sections based on specific logic. This sharpens the analysis, and reports become more impactful. Plus, it’s wholly customized to the audience receiving the report.
As an analytics platform, Pyramid Analytics empowers analysts and end-users to build models and interrogate data in a single self-service environment. Importantly, it treats narrative reporting—reporting that provides deep data-driven context beyond the static data views and visualizations found in traditional reporting—as a core part of the analytic lifecycle. Users can craft and automate engaging, dynamic narrative reports using the very same tool they use to prepare data models and conduct advanced analytics inquiries. When reporting ties directly to data, includes dynamic content that provides deep context, and conforms to established security protocols, reporting shows more than just historical facts—it delivers contextualized insights that point the way to better decisions.

BI Trends
2023 was the year of AI in almost every industry. However, when it comes to…

Thought Leadership
Introducing Data Shark Podcast, with Omri Kohl Pyramid Analytics’ CEO, Omri Kohl, is a busy…
Thought Leadership
Organizations that use analytics often experience a gap between analytics results—the products of data preparation,…

Events
Disclaimer: This article is the opinion of Pyramid Analytics and does not constitute an endorsement…
Events
Disclaimer: This article is the opinion of Pyramid Analytics and does not constitute an endorsement…

Thought Leadership
Has “augmented analytics” reached peak hype? It certainly feels that way. Countless software vendors in…

Thought Leadership
A conversation with the business analytics expert and professor, Gauthier Vasseur “Data is not important.…
Mythbusting
Data replication is the process of storing the same data in multiple spots to improve…
Mythbusting
Does it still make sense to take a department-by-department approach to analytics? Can you invest…