
- Solutions
-
-
Featured Solution
 Get more value from your existing SAP BW and SAP HANA investments with our SAP integrations.
-
-


Selecting a business intelligence solution can be overwhelming, given all the dimensions to consider—for example, business requirements, size of the implementation, the product’s ease of use, and price-to-value perception, among others. The BARC Business Intelligence Survey 14, with results released in October 2014, makes this task slightly easier by providing key dimensions or key performance indicators (KPIs) for measuring and comparing vendors based on customer feedback.
This blog series explores some key vendor and product dimensions that BARC measured. We are grouping these dimensions into the following themes or categories:
* Pyramid Analytics consistently scored high in dimensions that fall within these themes.
Suppose that you’re trying to book a flight for your upcoming vacation. Luckily, you find that there’s more than one airline that flies to your destination. You might select the airline that offers the best connection or the lowest price. Alternatively, there might be two airlines with a similar flight schedule and price; however, your experience with one of those airlines in recent years hasn’t been the best, which influences you in choosing a competitor. In still other cases, an airline might even offer a lower price and better connections, but your experience with it has been so unsatisfactory that you’ll do practically anything to avoid it.
The nice thing is that you usually have, at least to some degree, the luxury of choice.
At the end of the day, success is, in large part, determined by the users of a given product or service. How they feel, what their experience has been like, and what they say to others about their experience—particularly in this era of pervasive and influential social media—can have a significant impact on the success or failure of a business, product, or service.
Loyalty is a significant benchmark of success.
This blog post looks specifically at how product satisfaction and customer satisfaction are significant elements within the notion of “users at ease,” and how Pyramid Analytics is viewed in this regard, through the lens of respondents to the BARC BI Survey.
What exactly do we mean here by “users at ease”? Basically, in this context, this phrase encompasses the entire user experience, and is an experience that culminates in user loyalty—and by extension, customer loyalty.
A user at ease can be witnessed through several KPIs such as:
Also, overall ease of use contributes to users at ease, and good-quality product and customer support can help make a product that much easier to use.
Let’s look specifically now at product satisfaction and customer satisfaction.
Frequent product enhancements and updates—particularly when these enhancements are based on user needs and the direction of the BI and analytics market, highly relevant user stories, and targeted feedback—can contribute immensely to a high degree of product satisfaction.
Bugs and functional limitations that are fixed or enhanced in a timely manner, helpful troubleshooting tips, and useful product tips in general also contribute to users—and by extension, enterprise customers—being satisfied with a product.
By having solid product support, there’s also the opportunity to have lower costs related to ongoing administration and maintenance.
In the headline results for Pyramid Analytics, product satisfaction is measured by the frequency with which problems were encountered with the product.
Survey results show that Pyramid Analytics customers view it as top-ranked in product satisfaction compared to other OLAP analysis and visual discovery vendors, and among the top two, compared to other dashboard vendors.
Within the context of the BARC BI Survey, customer satisfaction is basically an umbrella term that encompasses several elements such as the level of satisfaction with the product and with different types of support.
In the headline results for Pyramid Analytics, customer satisfaction is measured by looking at the combined KPIs of:
Survey results show that Pyramid Analytics customers view it as top-ranked in customer satisfaction compared to other OLAP analysis and visual discovery vendors, and among the top two, compared to other dashboard vendors.
Although there are mega-vendors whose BI solutions might provide a breadth of functionality, many enterprises choose smaller vendors. This choice might be, in part, based on the specific functionality of the platform that an enterprise will actually use to meet their regular top needs.
Among a multitude of other factors, the choice might also be partially influenced by the level, quality, and timeliness of the support they get from the vendor.
Enterprises embark on a relationship of sorts with a vendor. Vendors can make a reputable name for themselves by not just focusing on activities before the actual sale. Perhaps more important is what takes place after an enterprise purchases a BI solution.
Is there adequate and easily available product support? Is there local support? How much follow-up engagement is there with customers to help them via guidance, tips, and resources? Are there updates on the latest product enhancements to help users keep up with BI innovations and trends (like big data, mobile use, advanced analytics), to be more effective in their everyday, practical tasks, and to build on current technology investments?
If the answer to these questions is a resounding “yes,” chances are that users (and customers) will be loyal ones, find ongoing value in the enterprise’s purchase. When the time comes, it’s more likely that the enterprise will renew their product license rather than abandon their purchase for a replacement solution.
In the headline results for Pyramid Analytics measured by user satisfaction with the level of support that the vendor provides for the product.
Survey results show that Pyramid Analytics users view it as top-ranked in after-sales service and vendor support compared to other visual discovery vendors, and among the top three, compared to other dashboard and OLAP analysis vendors.
Although strong vendor support is vital, so, too, is support from those who are doing the actual implementation of the solution. Are they readily available to offer assistance and tips, to troubleshoot, and to answer questions? If so, users are more likely to feel at ease with the product they are using, and more confident in the results they achieve.
Survey participants were asked to rate the quality of support that the implementer provides.
Again, in the survey, implementer support is an underlying KPI of the overarching category of customer support. Pyramid Analytics’ scores here contributed to its high ranking in customer satisfaction compared to other OLAP analysis, visual discovery, and dashboard vendors.
As part of its strong vendor support, Pyramid Analytics closely engages with potential users who are part of the customer base. As part of its post-sales support, it works closely and follows up with customers on an ongoing basis. Pyramid Analytics constantly strives to enhance its product offerings, for instance, building upon BI Office’s functionality, performance, and integration.
BI Office users can get support for tasks they perform regularly. And at a higher level, enterprises can gain insight into, for instance, how to build upon current technology investments such as in SQL Server Analysis Services or relational data that they might already have in SQL Server.
One of the many manifestations of “users at ease” with a BI platform is how happy they indicate they are with the level and quality of product and customer support.
In today’s heavily populated vendor market, users who don’t feel comfortable or confident with the support and overall experience they are receiving can influence decisions on whether to stay with a proven, trusted BI solution or to investigate alternatives.
Whether it’s deciding which airline to take on your next trip, or which BI platform will figure into your BI strategy, strong product and customer support can tip the scales, contributing not only to user satisfaction, but to success that translates into loyalty.
* Disclaimer: The ideas expressed in this blog post are those of a Pyramid Analytics author, based on the headline results for Pyramid Analytics in the BARC BI Survey 14. They do not represent the ideas of BARC itself.
1. BARC, Headline Results for Pyramid Analytics in the BARC BI Survey 14, October 2014.
BI Trends
2023 was the year of AI in almost every industry. However, when it comes to…

Thought Leadership
Introducing Data Shark Podcast, with Omri Kohl Pyramid Analytics’ CEO, Omri Kohl, is a busy…
Thought Leadership
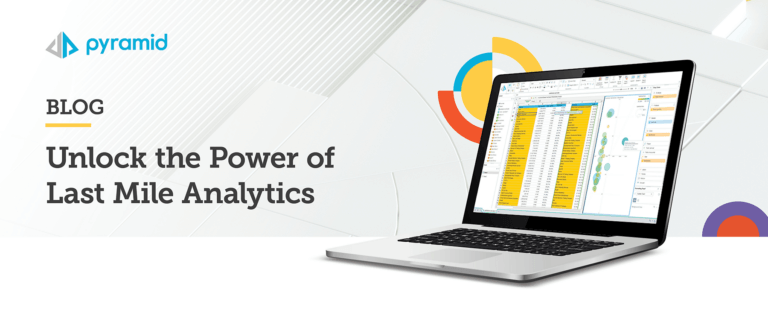
Organizations that use analytics often experience a gap between analytics results—the products of data preparation,…
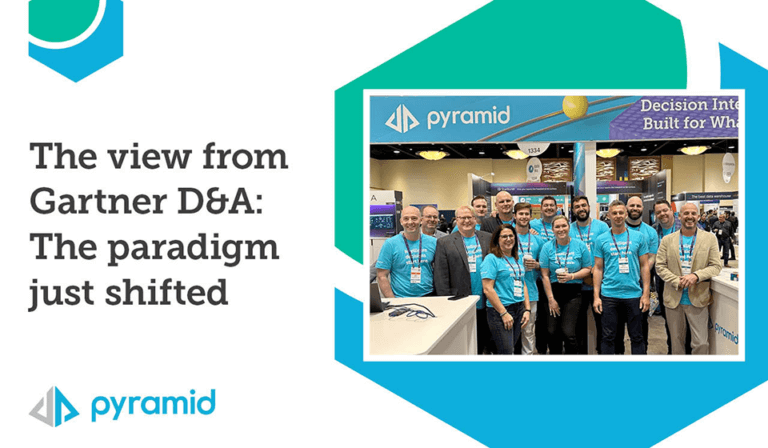
Events
Disclaimer: This article is the opinion of Pyramid Analytics and does not constitute an endorsement…

Events
Disclaimer: This article is the opinion of Pyramid Analytics and does not constitute an endorsement…

Thought Leadership
Has “augmented analytics” reached peak hype? It certainly feels that way. Countless software vendors in…

Thought Leadership
A conversation with the business analytics expert and professor, Gauthier Vasseur “Data is not important.…
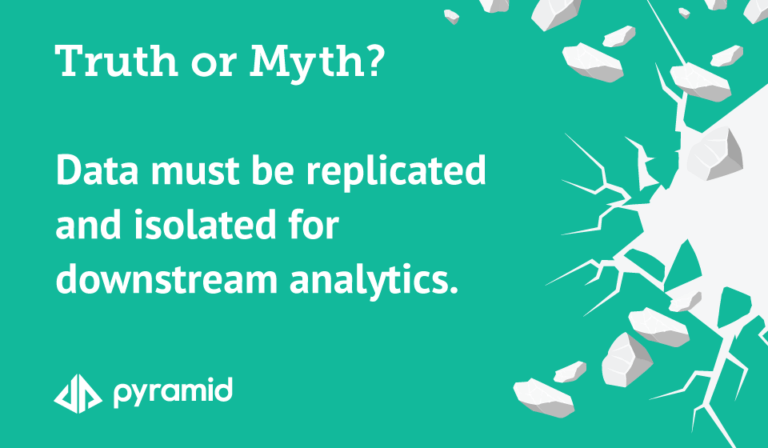
Mythbusting
Data replication is the process of storing the same data in multiple spots to improve…
Mythbusting
Does it still make sense to take a department-by-department approach to analytics? Can you invest…