
- Solutions
-
-
Featured Solution
 Get more value from your existing SAP BW and SAP HANA investments with our SAP integrations.
-
-


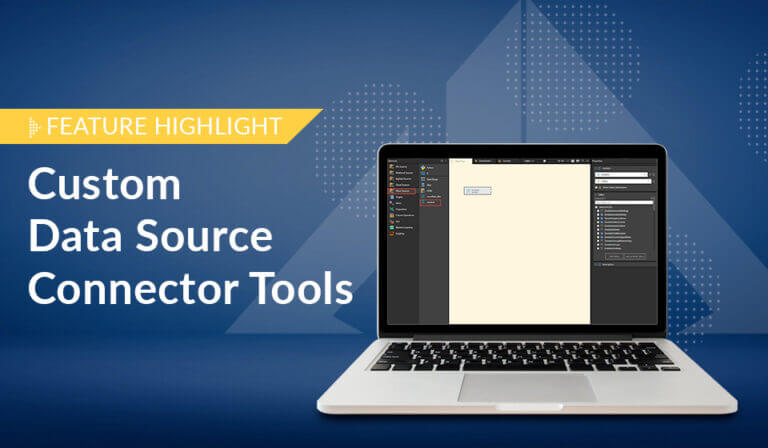
Pyramid provides administrators the ability to self-configure connectors for almost any JDBC data source, providing users access to these data sources. As more applications and databases are developed it is Read more…

Pyramid’s “Explain” feature performs automated analysis directly against any data source in a single, on-demand click.

While Pyramid includes over 50 core visuals out-of-the-box (that can be extended to over 200 variations), it also offers the option to build and integrate custom visuals into the platform Read more…

Webhooks provide a mechanism to publish information to external applications like Microsoft Teams, Slack and other enterprise applications about an event, an updated status, or any other completed milestone. For Read more…

The administrative overload of ensuring each user receives all their reports in the right format at the right time can be overwhelming. Self-service analytics, by definition, should provide the ‘right’ Read more…
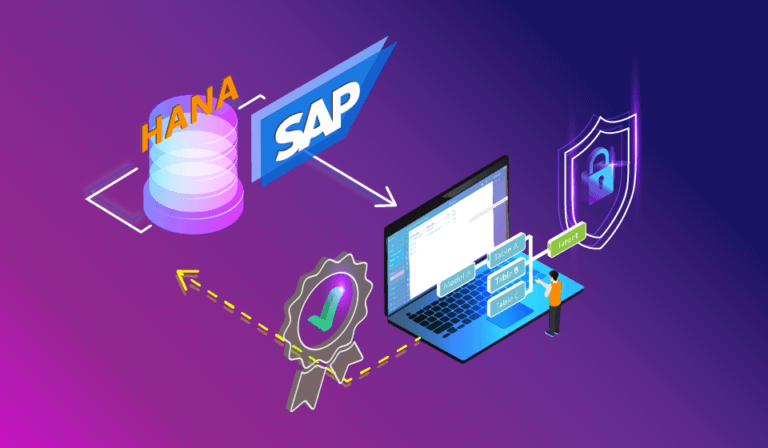
SAP customers simply want “Real self-service BI that works directly on SAP HANA.” Pyramid provides exactly that.
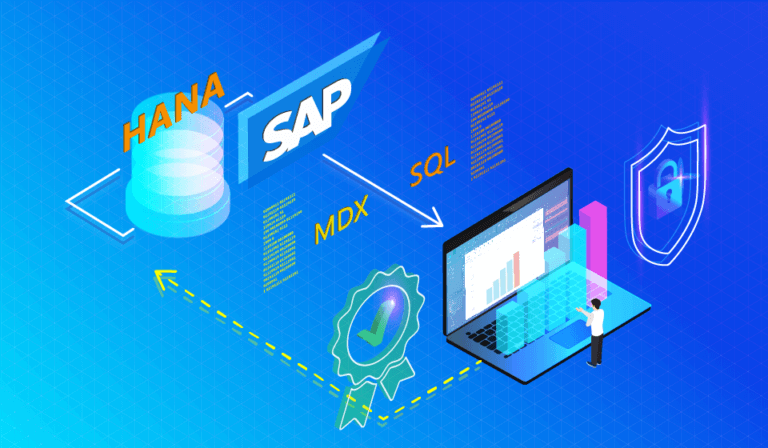
Pyramid provides the fastest analytic solution for SAP HANA using SQL, while still exposing all its deep analytic logic and functionality.

Row-level or ‘Member-level’ security is a fundamental requirement in most analytic projects controlling which data items different users can view and analyze, from the highest level of detail down to Read more…

In analytics and BI applications, a tooltip can be an invaluable mechanism to display informational text when hovering a mouse cursor over a graphical item on a screen, dashboard, or Read more…

Data-driven text, like data-driven infographics, can help users better learn and understand new information. Data-driven text and messages can communicate analytical insights more effectively and complement classic data visualizations or Read more…

Data-driven infographics can be a highly effective way to help users learn new information. The more graphically intuitive an analysis, the quicker and easier it is for users to understand Read more…

As described in my previous blog post, bursting static analytic reports to recipients is still a very common “real-world” requirement—and it’s still a headache for many BI developers and organizations. Often Read more…