


The Pyramid decision intelligence platform
Smart, AI-driven business analytics for decision-makers
Yesterday’s business analytics tools aren’t enough for tomorrow’s decisions. That's where Pyramid comes in. Pyramid's business intelligence platform features AI at its core to augment and automate analytics for non-technical users. Business analytics allows business users to build analytical content throughout the platform, from data exploration and visualization for descriptive analysis to decision modeling for prescriptive analytics.
Business analytics to help people make decisions with data
Self-service and visualizations alone haven’t gotten us any closer to better decisions. Pyramid is changing that. By delivering the full breadth and depth of business analytics features through a modern, no-code, intuitive UI with smart analytics, Pyramid helps anyone build sophisticated analytic content. The platform makes robust decision-making a reality for everyone in the new era of decision and business intelligence.


Pyramid Analytics is one of the best BI platforms with a breadth of capabilities that allows you to get the most out of your data in the shortest possible time.

Pyramid is the #1 ranked BI platform in all 4 Gartner Use Cases
In its latest Analytics & Business Intelligence Critical Capabilities report , Gartner recognized Pyramid as the highest ranked solution for Business Analysts, Augmented Consumers, Advanced Developers, and Data Scientists.
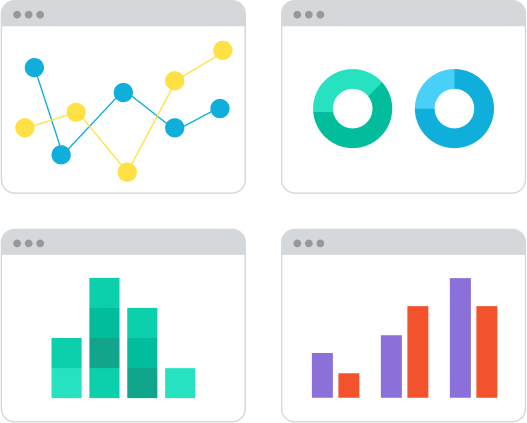
Data exploration and visualization
Discover visualizations, perform ad-hoc and interactive analytics, and create content for dashboards and publications. As the central venue for content authoring on the system, users can explore data and build smart visualizations using external or internal semantic models. Build queries intuitively by dragging attributes and measures into drop zones to drive over 200 different visualizations with hundreds of formatting and layout options.
Slice, dice, and drill data using intuitive context menus to interrogate and explore your data, build point-and-click calculations, and drive operations like pivot, filter, sort, and totaling.
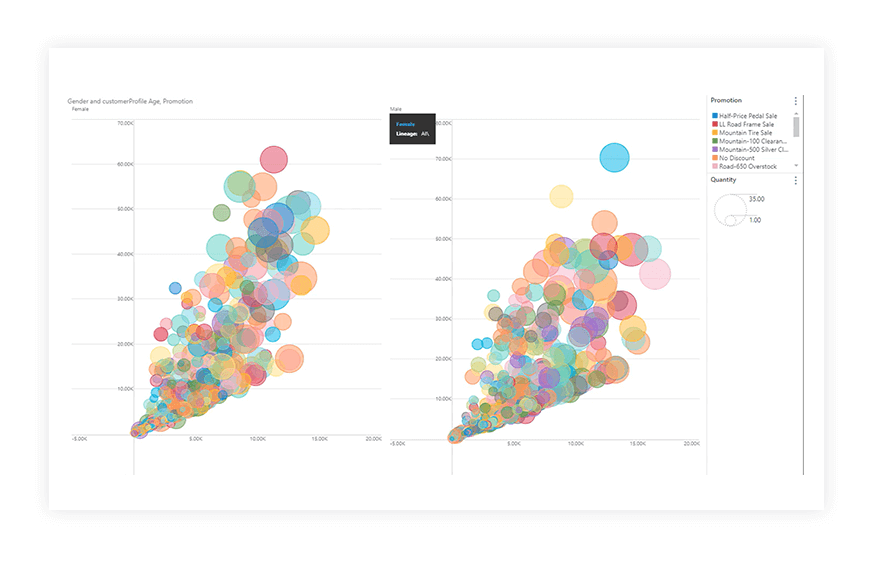
AI-driven for instant insights
Using wizards and advanced tools, you can drive sophisticated no-code analyses and reuse them in other parts of the platform.
Pyramid Smart Discover uses machine learning and AI techniques to auto-analyze your data. Smart Discover is an AI-driven tool for helping non-technical users build analytical content using augmentation engines and heuristics to uncover unexpected insights. Supercharged AI capabilities, like Explain and Explain the Difference, let you deconstruct results with ML in a single click, while the natural language querying chatbot lets you ask complex analytic questions interactively using plain language.
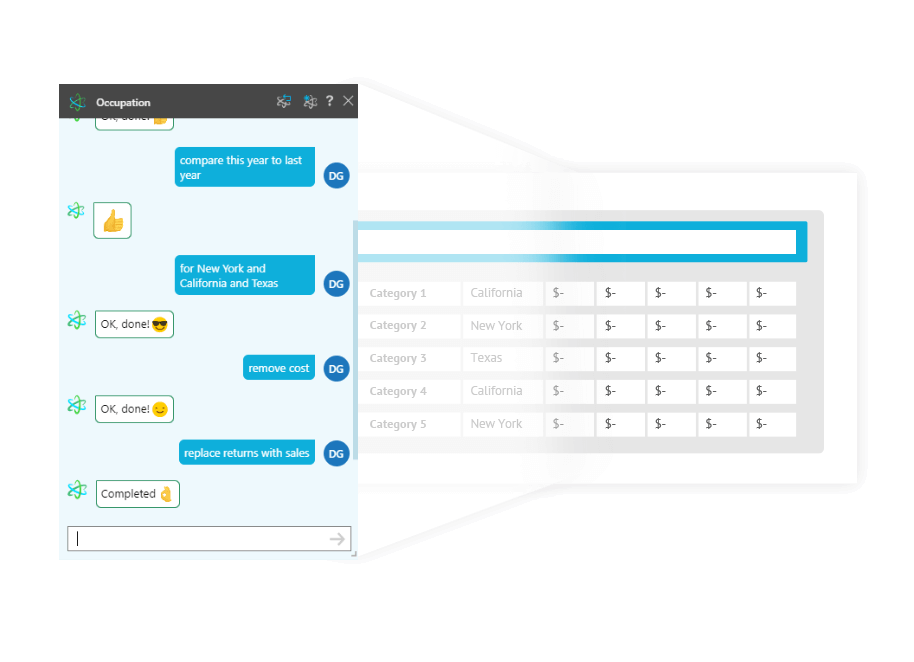
Smart visualizations using NLQ
Pyramid’s chatbot takes an intuitive and flexible approach to report-building and data discovery that lets everyday users build data visualizations. Pyramid automatically selects the most appropriate visualization for the data in your NLQ question using its AI-driven Smart Visualization engine. Using plain language, users can alter visualizations, drill, dice, swap, filter, and sort data. Users can ask questions without knowing the underlying data structures, hierarchies, and measures.
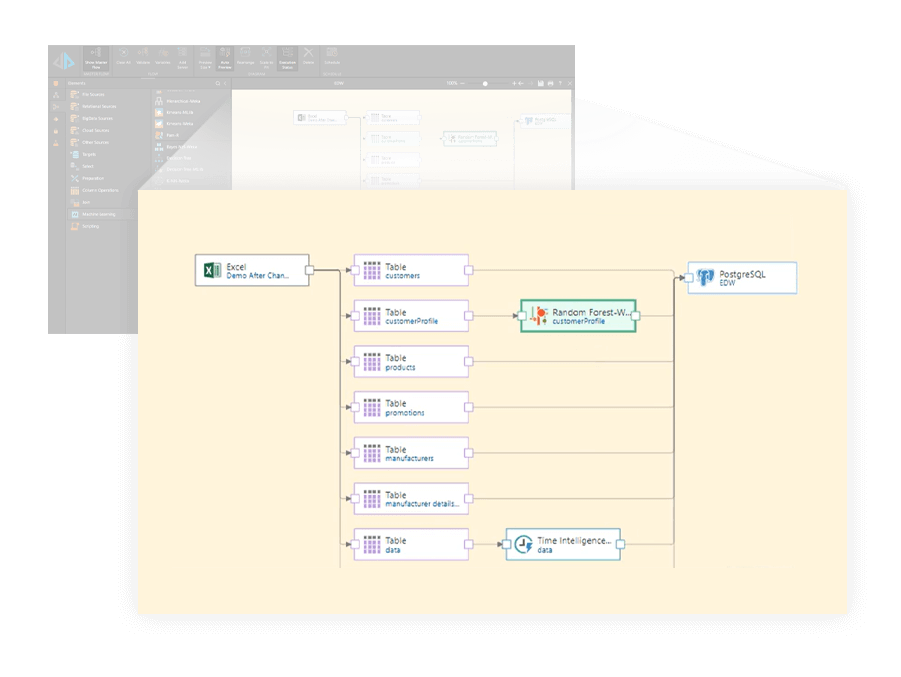
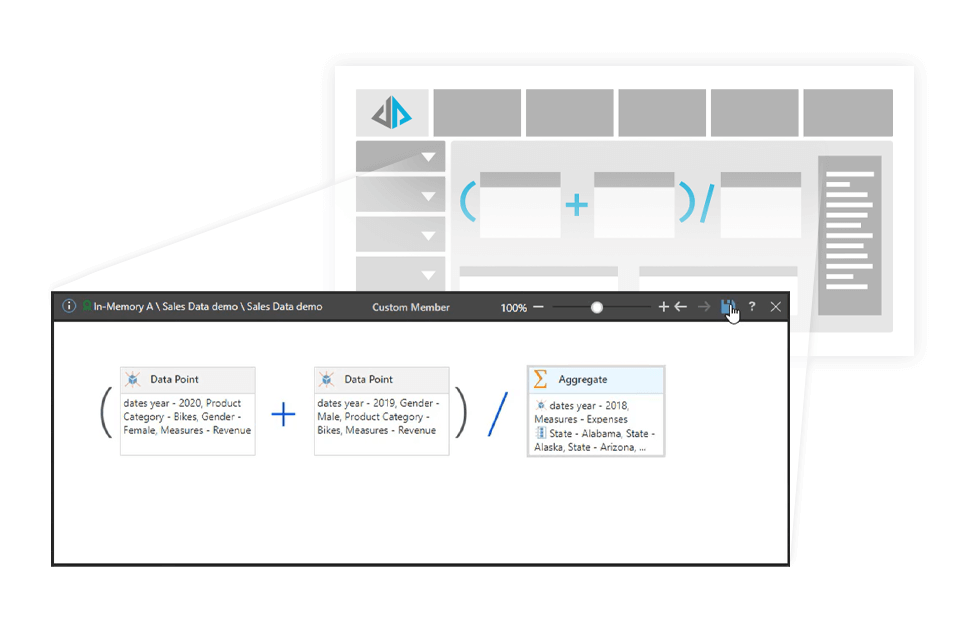
Intuitive formula builder
Pyramid’s Formulate lets users create calculations and business logic for reports and dashboards. It has a graphic drop-and-drag user interface that enables any user to build custom KPIs, member lists, formulas, scripts, and more. Inject dynamic elements into the query at runtime using parameters. Solve granular, semantic, and context calculations with the multi-tiered calculation engine. Share business logic, design and custom visualizations or write R and Python ML scripts for predictive analysis.
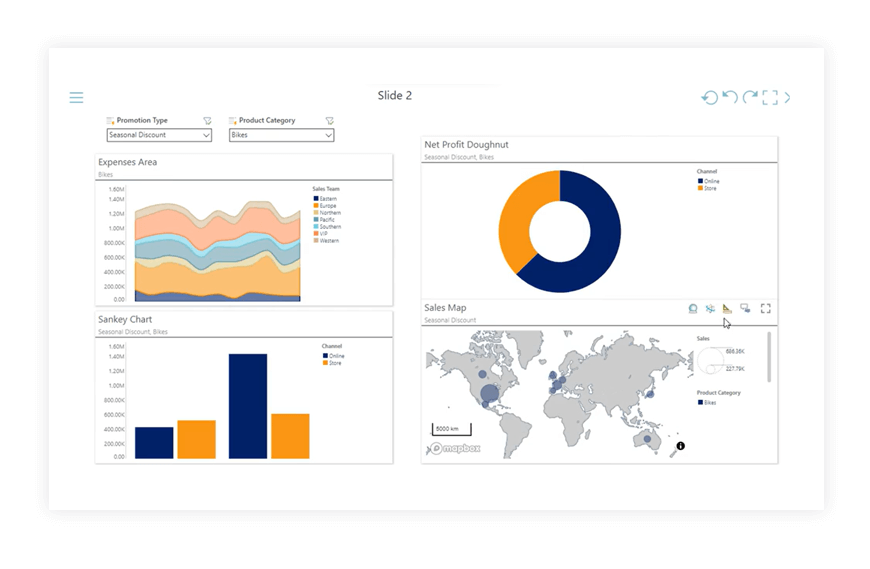
Interactive storyboards and dashboards
Present enables users to easily design and build storyboards for live, interactive analytical content using shared content from multiple data sources concurrently. It features advanced graphical tools, multiple layout options, and endless format settings. Create fully customized charts, infographics, and real-time dashboards for eye-catching, dynamic presentations. Enrich presentations with charts, infographics, text, slicers, third-party information, images, and data-driven dynamic elements. Use natural language to generate designs for content and graphics for storyboarding and publications using the ChatGPT integration for faster content creation.
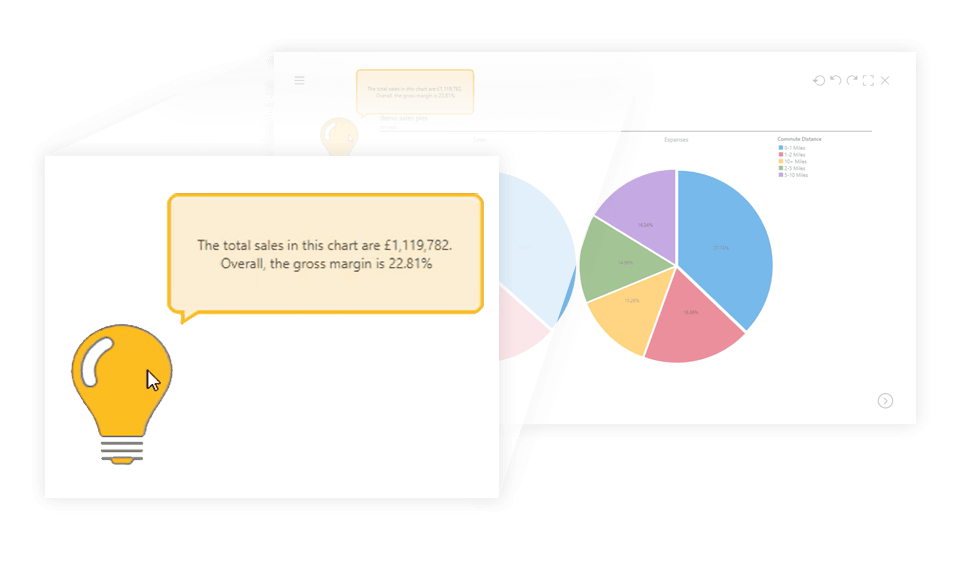
Dynamic, data-driven images and text
Use Illustrate to build dynamic data-driven images and text to add to presentations and publications. Build infographics that dynamically change color, shape, position, and size at runtime based on query results. Configure data interactions between images and text and a selected content item to create dynamic images and text that add additional meaning and context to storyboards and publications.
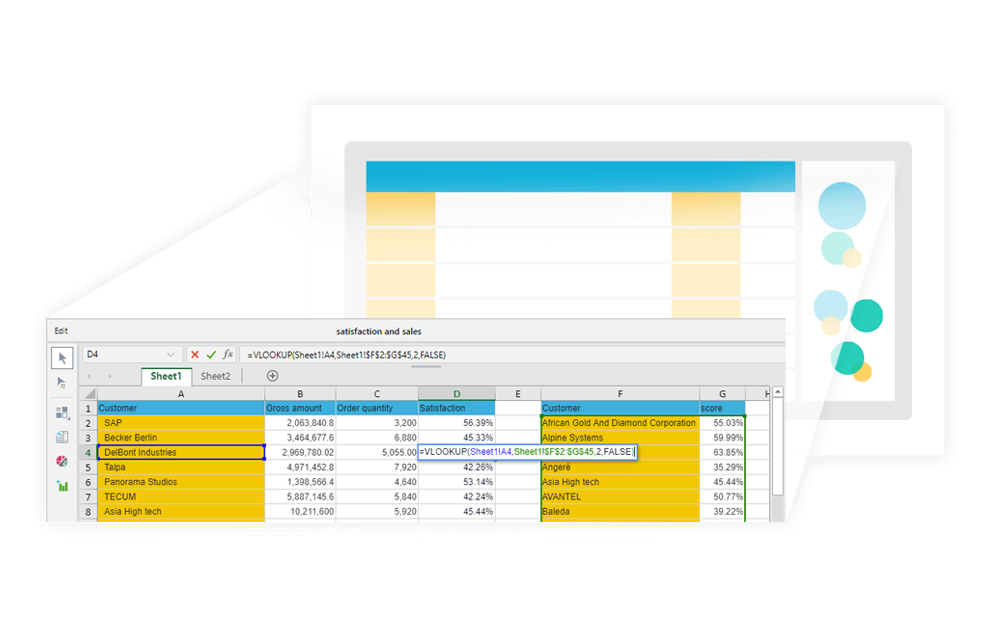
Business and decision modeling
Tabulate brings a browser-based virtual spreadsheet interface to extend data analysis. It delivers business modeling with live data through query mashups, multi-query visualization, and flexible formatting. Use familiar spreadsheet formulas to create blended visualizations and business models from multiple data sources. The Solve plug-in lets you build optimization and decision models in the spreadsheet to drive what-if analysis and simulations. Snippets and visualizations generated from Tabulate and optimization results from Solve can be embedded in storyboards and publications.
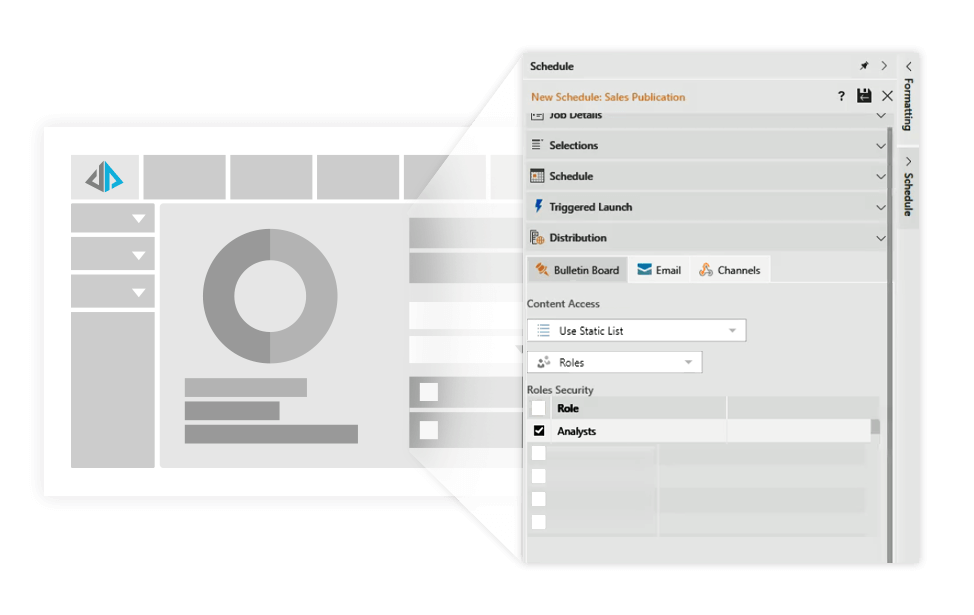
Enterprise-wide reporting
Pyramid provides both live, interactive analytics and static report distribution with Publish. The powerful report-bursting capability enables users to receive customized content using specific personalized data. Only a single report template is required which means no more manually building multiple visuals and content through error-prone cutting and pasting. Build templates comprising data visuals, illustrations and text with full control over styling, branding, and layout to drive the delivery of enterprise reporting. Schedule and dynamically distribute pixel-perfect reports in formats like PDF, Word documents, or PowerPoint.
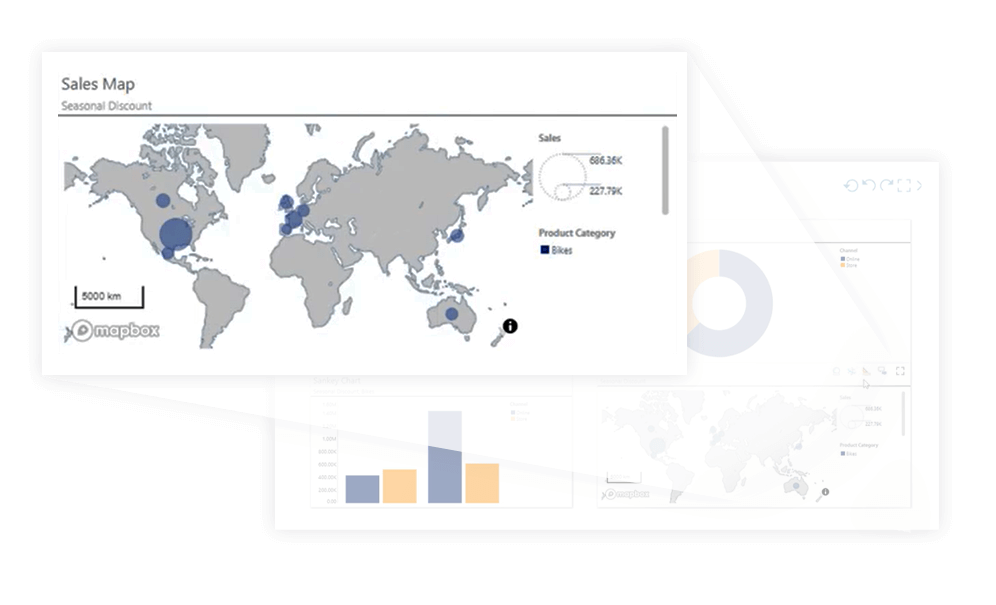
Geospatial analysis and visualization
Pyramid handles most geospatial formats and applies automatic geocoding to spatial datasets. Users can automatically render spatial visualizations of their data whether the data model contains geolocation hierarchies or parallels (latitude and longitude). Leverage geospatial algorithms for defining radial boundaries to analyze underlying characteristics. Calculate distances using the Geo Distance function. Build bubble maps, shape maps, geo heat maps, and custom maps. Types include flat, topology, satellite, and street maps.
The Pyramid business analytics experience

AI-driven business analytics
Pyramid was built from the ground up to help non-technical and technical professionals produce sophisticated analytics with AI-driven insights.

Unified collaborative platform
Pyramid delivers full enterprise business analytics in a single, unified platform with fully featured collaborative tools. Analysts can collaborate, share, and re-use analytical content across the platform.

Self-service analytics
Pyramid’s platform delivers self-service business analytics for faster insights and better decision-making. Empower your entire organization to make more impactful, informed decisions.
Self-service business analytics done right


Learn more about business analytics with Pyramid
THE FOURTH WAY
The new approach to AI-Augmented BI that delivers results where others fall short

Pyramid lands 30 Top Ranks and 34 Leading Positions overall
Independent proof from the BARC BI & Analytics Survey 26 confirms what customers already know.…
The BARC Survey Results are In: Pyramid Leads the Pack for Business Benefits, Self-Service, Flexibility and More
In the premier BI & Analytics survey from BARC, the results couldn’t be more clear.…