- Solutions
-
-
Featured Solution
 Get more value from your existing SAP BW and SAP HANA investments with our SAP integrations.
-
-


While a good report turns data into information, artificial intelligence (AI) has the potential to transform information into insights—without human intervention. It’s common to see analysts spend an inordinate amount of time plowing through reports and dashboards.
After endless slicing, dicing, drilling, and pivoting, they gather insights to piece together a paragraph to be inserted into board reports, presentations, emails, and more. The dual task of ensuring the data is valid while providing valuable and accurate insights is often too time-consuming and taxing to be worth the effort to deliver the insights that management demands.
Providing valuable insights requires a solid understanding of the business, data analysis skills, reliable data sources, and a huge amount of effort. Using predefined templates to generate text is not always functional, takes a lot of time to design, and offers only a limited method for finding and articulating diverse insights.
Complicating this further, different analytic scenarios require varying levels of detail depending on the audience and the presentation’s content. While several BI tools offer smart, natural language-generated insights, they are limited to insights on proprietary data engines, and the feature doesn’t always work on other non-proprietary databases. What’s more, their insights are often limited in scope and range. To be effective, broad insight generation must include multiple types of analyses, including Pareto, trends, outliers, and relationships.
Pyramid’s Smart Insights are used to generate AI-automated natural language analysis of a given visualization or dashboard, with valuable information about the data presented in readable text. Insights are dynamically generated by various statistical and analytical methods to produce different sets of analyses based on the query selections. Smart Insights can provide light metric analyses without covering categories, categorical analyses, or advanced, in-depth metric analyses.
Crucially, Smart Insights are generated on any supported data source (SQL or MDX)—and they are not constrained to Pyramid’s own data engine. They are not affected by the structure of the data or its size. Further, Smart Insights can be focused on a single visualization, a composite analysis across an entire slide of visuals (or dashboard), or it can be set to analyze an entire data model. In addition to basic analyses, Smart Insights can produce Pareto trends, forecasts, outliers, and relationships in narrative form.
Finally, Pyramid’s Smart Insights are live and dynamic, regenerating in real time to reflect any manipulations or changes to the query.
Diana, the CFO for D&R Retailers, uses Pyramid to perform analytics on her Redshift data warehouse. She has used Pyramid’s Natural Language Query Chatbot to answer questions while browsing dashboards and viewing reports. Diana is looking for the “gold nuggets” from her dashboards without having to sift through the data and compile insights.
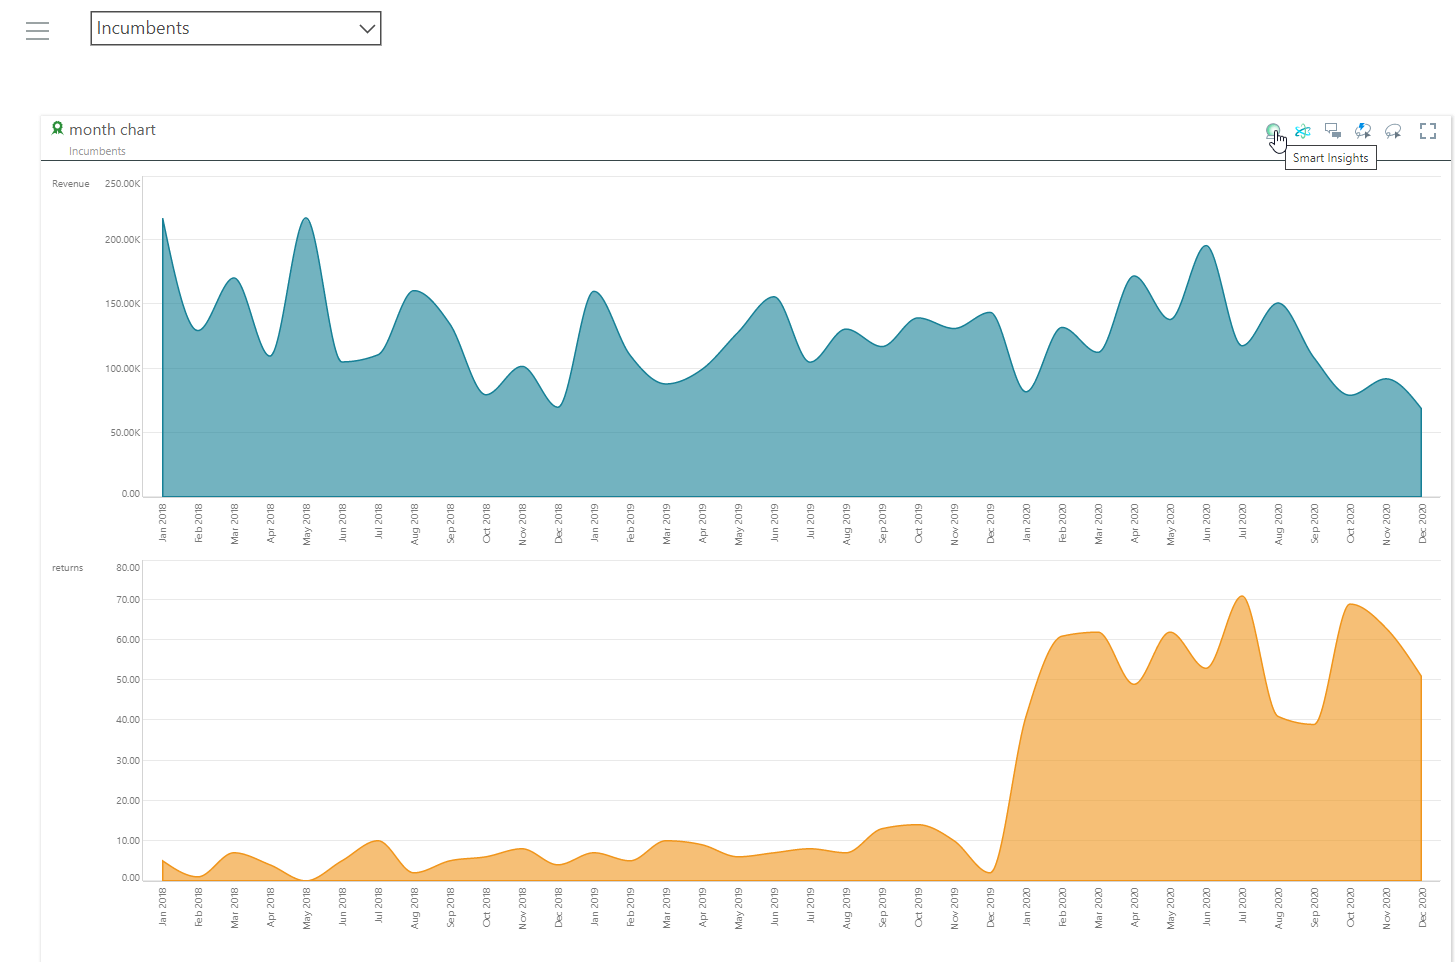
Diana opens a dashboard that analyzes revenue and returns over the last three years. To gain “smart” insights, she clicks on the Smart Insights button (appearing as a wizard’s crystal ball icon) on her dashboard.
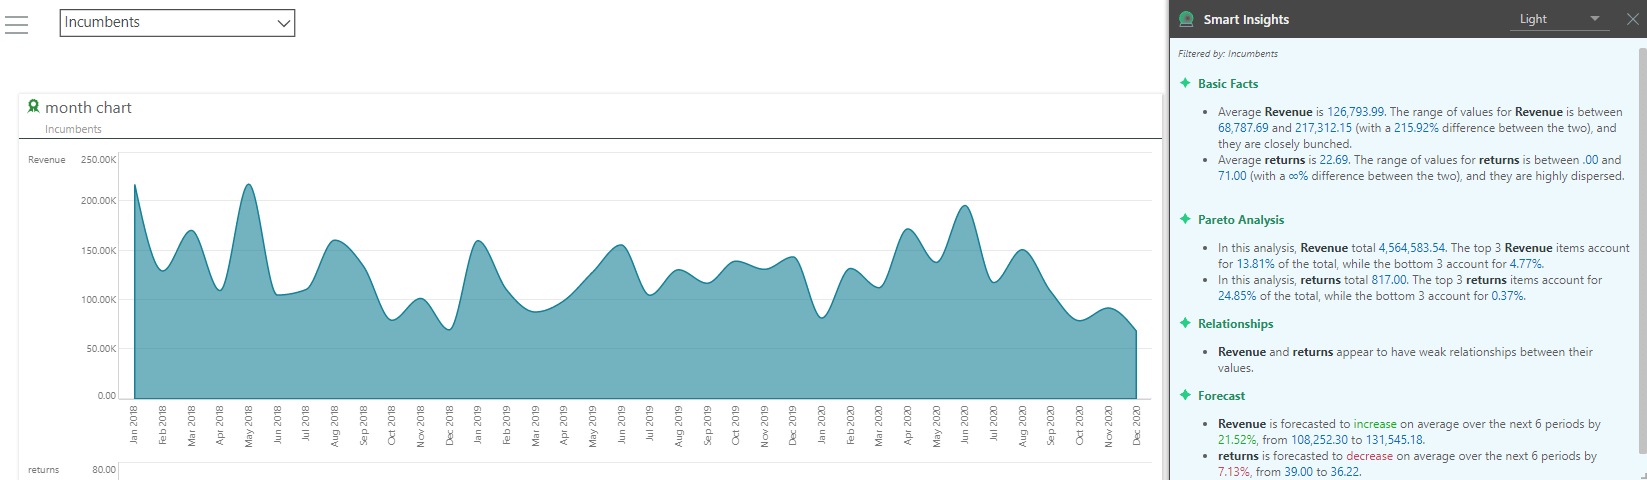
Diana has immediate access to insights on the dashboard with varying levels of detail. The “light” option offers a wealth of useful context. It performs a pareto analysis on the data, reviews relationships between measures, and produces a forecast based on historical data using a best fit forecasting algorithm. No sifting through data or writing of complex code required.
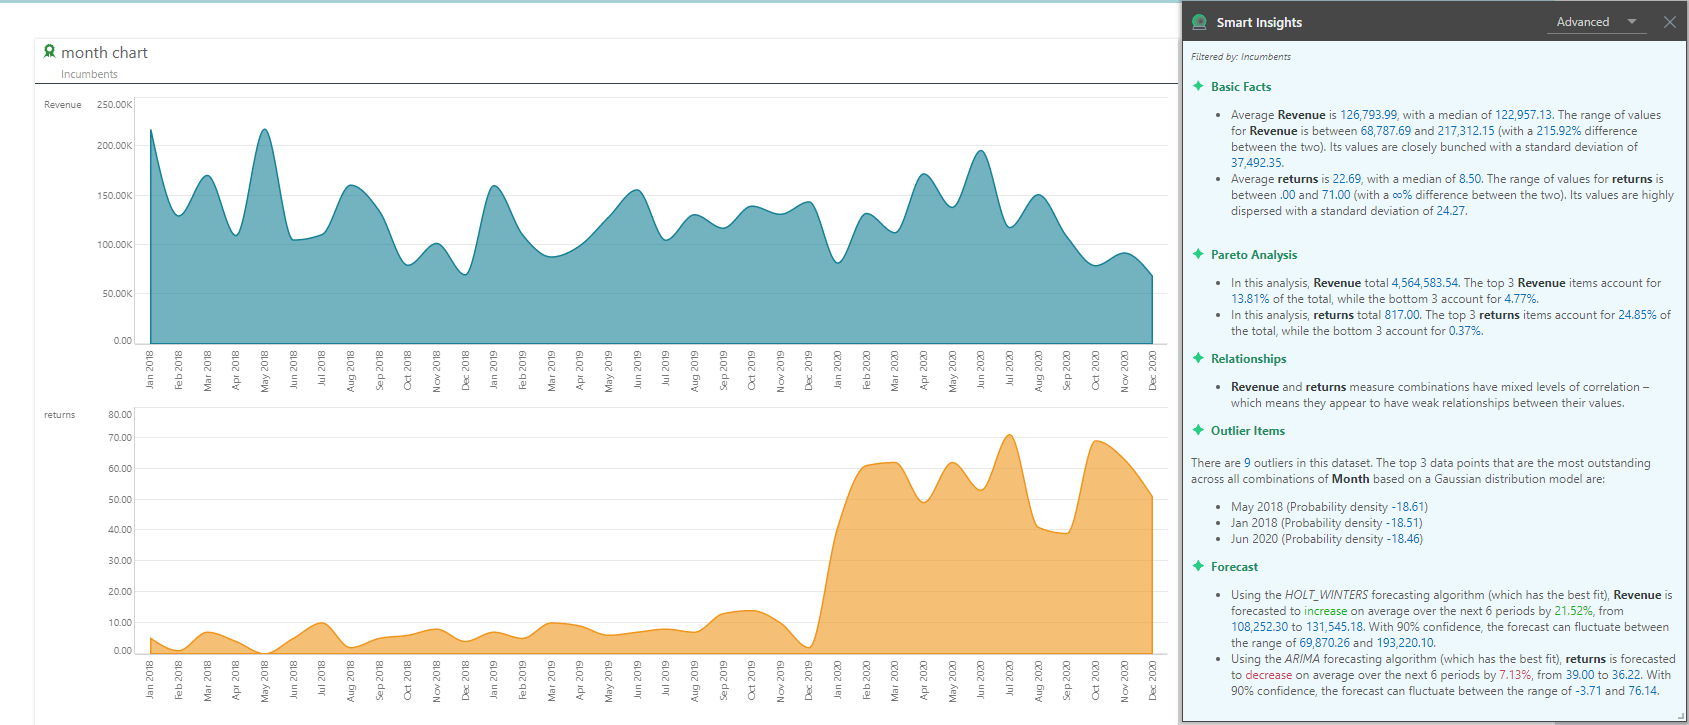
Diana then selects the advanced option to gain deeper and more detailed insights. She views additional details such as outliers and deeper insights into forecasting, standard deviation, and more.
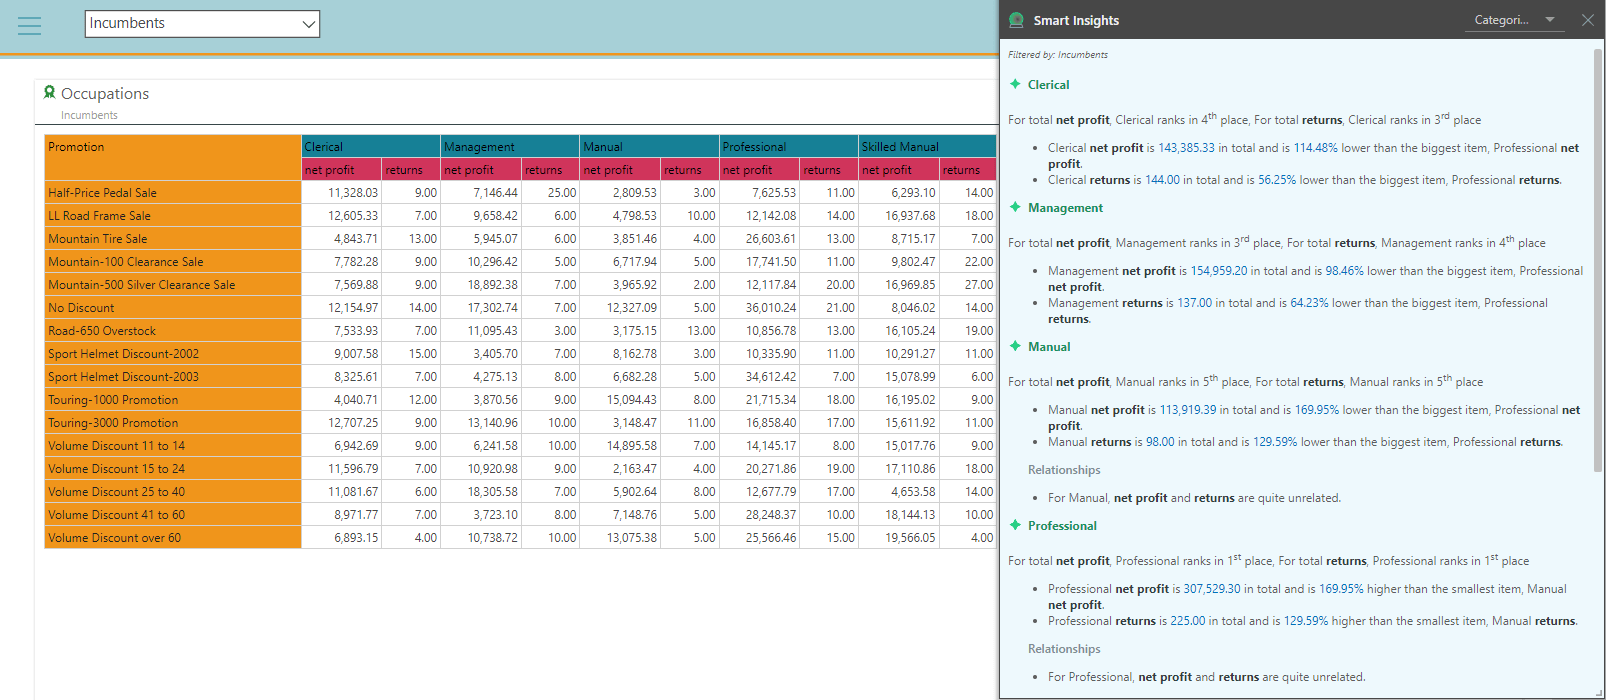
Next, Diana views a grid that displays net profit and returns for all occupations according to different promotions. Here, Diana selects the categorical option and sees how the various categories compare with one another in terms of rankings and percentage differences.
With the help of Pyramid’s Smart Insights, Diana once again appears like a “pro.” And she understands the data far deeper than if she were looking at the visualizations and grids alone.
Want to see Smart Insights in action? Look no further!
A critical outcome of analytics is the time-consuming task of providing business insights. Predefined templates do not by themselves provide a sufficient mechanism for producing diverse insights. Far worse, they simply take too much time to create.
While various BI tools offer natural language insights capabilities, the features typically only operate on proprietary data engines—not on all databases—making their use highly limited.
In contrast, Pyramid’s Smart Insights use a variety of statistical and analytical methods to dynamically generate AI-automated natural language analysis of visualizations on any database. The tools also provide users with that ability to produce analysis with varying levels of detail—featuring light, categorical, or advanced in-depth formats—all generated in real time.

How-To
SAP is essential enterprise software. Your organization has made significant investments in SAP. You've tailored…

How-To
Pyramid’s built-in multi-factor authentication (MFA) option adds a rock-solid layer of security to your BI…

How-To
Administrators occasionally need to check complicated settings and security structures for users. Sometimes the easiest…

How-To
Pyramid lets users customize and personalize the labels of value metrics and hierarchies for a…
How-To
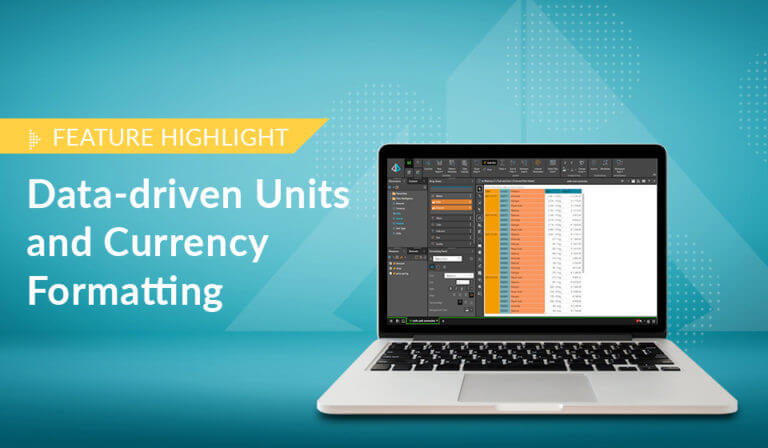
Static data format masks, used to format values in analytics) is a standard feature in…
How-To
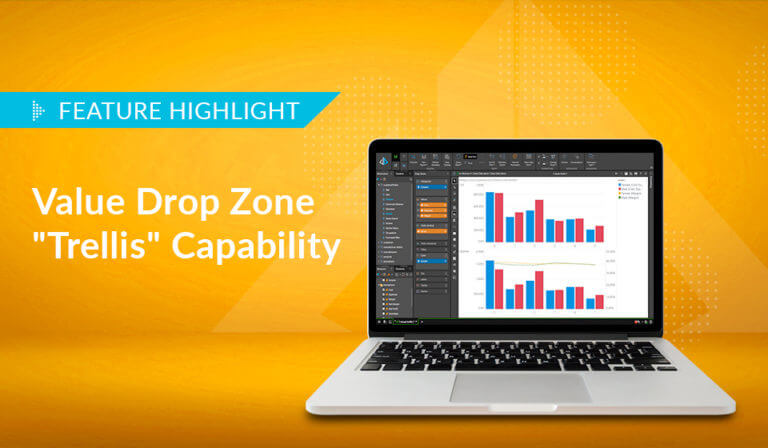
Pyramid lets users display multiple value metrics in a single report, each with its own…

How-To
Pyramid’s persistent color feature maintains the same color in all visualizations for selected data elements,…

How-To
Pyramid offers flexible, intuitive security for parent-child hierarchies, providing role-based control over how members are viewed…
How-To
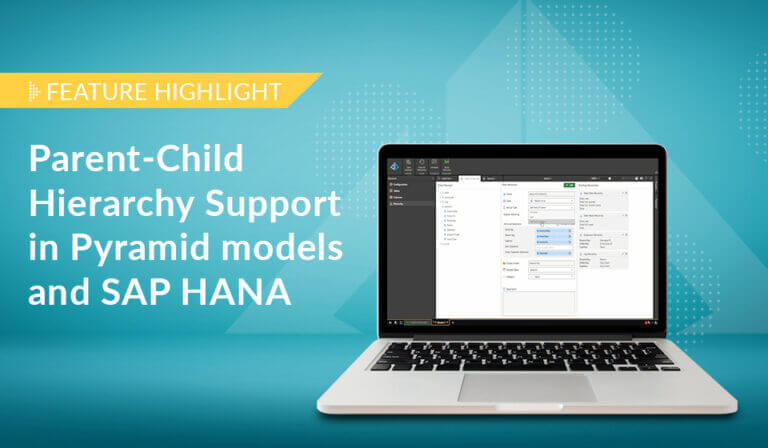
Pyramid excels in its’ native support for parent-child hierarchies, automatically generating hierarchical structures and providing fluid,…