- Solutions
-
-
Featured Solution
 Get more value from your existing SAP BW and SAP HANA investments with our SAP integrations.
-
-


Pyramid is an official member of the SAP® PartnerEdge® open ecosystem and is fully certified by SAP on SAP BW/4HANA, SAP HANA, and SAP Netweaver. The Pyramid Platform is also available on the SAP Store.
What differentiates modern self-service BI tools from their legacy counterparts is their “point and click” and “drag and drop” functionality, shielding users from needing deeper technical expertise, such as writing code.
Third-party tools that profess to offer more mature self-service capabilities cannot fully work directly on SAP BW and HANA. They force users to extract, reload, and duplicate the data, thereby introducing data governance and security headaches.
The challenge, then, is to find a real self-service analytics platform with requisite functional depth that works directly on SAP BW and HANA. Finding a platform that can build calculation logic beyond ultra-simplistic mathematics is even more difficult.
Consider the following business problem: a business user is analyzing monthly sales data and wants to track when important milestones have been reached. In order to achieve this, she would like to see running totals of sales in her SAP HANA view indicating when a $1M milestone was achieved. Due to the ad-hoc discovery nature of her investigation, she might also want to track this on different levels of granularity, such as by quarter, by month, or by week.
With Pyramid, a user can use a direct query on SAP HANA to query and retrieve the results below in a simple matrix grid in three clicks without having to extract the data into another database.
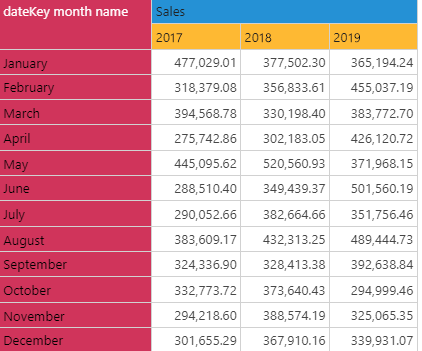
While this information provides sales information by month and year in an easy-to-follow grid, the user is not able to see when the $1M (or $2M and $3M) milestone was achieved. She needs the table to display running or cumulative totals to achieve that outcome.
Creating running totals in many BI applications is often part of an ad-hoc reporting exercise that requires finicky coding and depends on developers and the associated software development lifecycle.
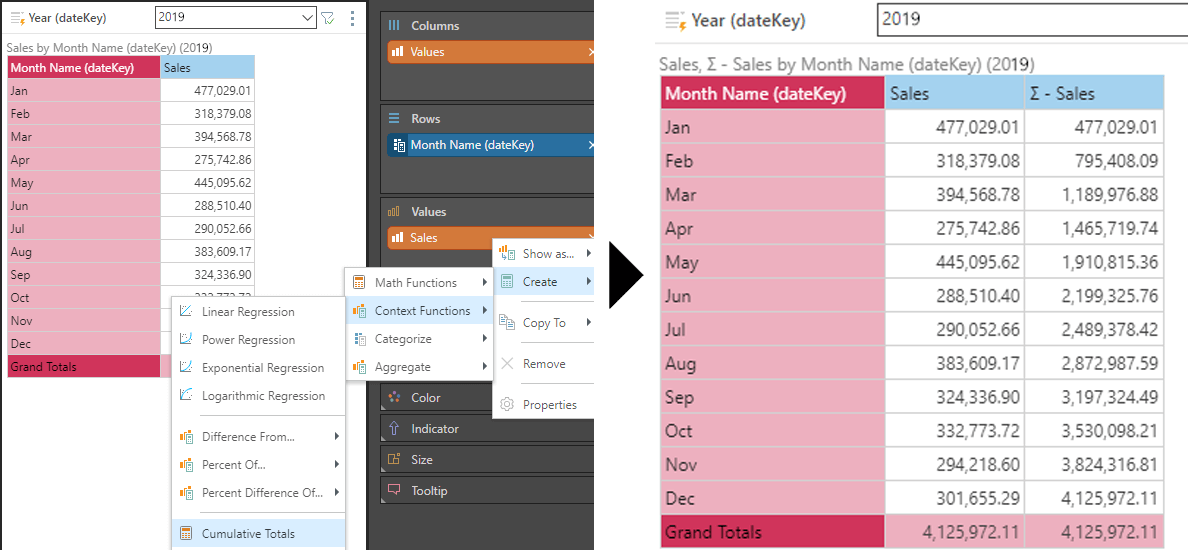
It’s a snap in Pyramid. With a single right click on any sales metric, a user can display dynamic “Cumulative Totals”—no code or data extractions required—on top of any query processed on SAP BW or HANA. The task doesn’t require the user to re-design the InfoCube or write highly technical BEx queries.
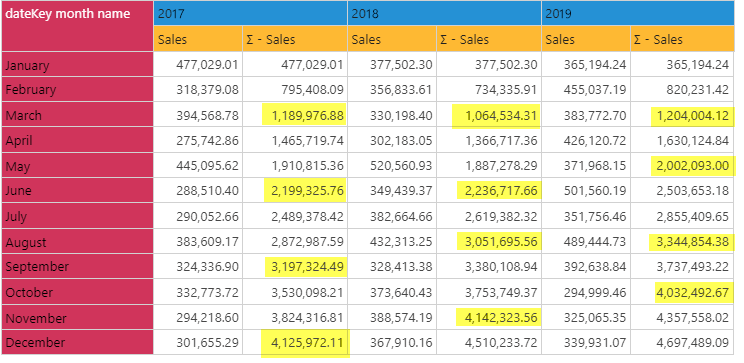
And when you swap out months or any other hierarchy—or add additional hierarchies—the running total is automatically recalculated. No extra code or steps is required. Now the user can easily see the key month targets highlighted below.
On less sophisticated platforms, each calculation will require the user to write code specific to that combination of dimensions and measures she wants to view in her visual or report. This is normally beyond the capabilities of most consumers, and even some proficient end-users will require assistance from an experienced developer. And this doesn’t even address the headache of connecting to SAP BW or HANA to get the data in the first place! For many BI tools, this inefficiency (across specifications, documentation, development, testing, etc.) is quite common.
In our example, the developer will need to create three different variables for company, salesman, and branch, each with three different time options for quarter, month, and week. That’s nine separate variables, each requiring a separate code. Yikes!
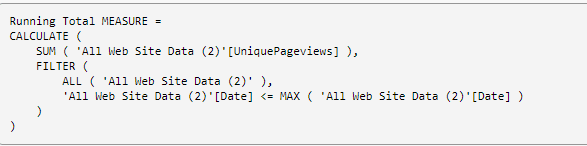
Just for color, here’s a sample of DAX code required to calculate running totals in Power BI (remember, the user would have to copy and adjust this calculation nine times):
At this point, business users will either spend a large amount of time creating all the variables and code required for this solution or decide that it is not worth the effort. When they reach this point, the most common alternative is Excel. And when users resort to Excel, it effectively defeats the purpose of having a centralized enterprise analytics and reporting strategy. Hello, data silos!
With Pyramid, users can create advanced calculations and logic that work directly on SAP BW and HANA. The logic, driven by a self-service paradigm, covers anything from basic calculations to sophisticated logical expressions.
To view Pyramid’s extremely powerful code-free solutions for other common business problems on any data source, including SAP BW and SAP HANA, see my previous blogs:
Pyramid solves this entire problem with a complete solution that offers real self-service working directly on SAP BW and HANA. How? By delivering best-in-class functionality and performance on SAP BW without extracting or duplicating data, Pyramid preserves the full analytic power of the SAP engines, as well as the inherent security and governance.
Please explore our Pyramid + SAP Blog Series to learn how Pyramid supports our customers on SAP. Each post contains specific examples to illustrate key functionality:

How-To
SAP is essential enterprise software. Your organization has made significant investments in SAP. You've tailored…

How-To
Pyramid’s built-in multi-factor authentication (MFA) option adds a rock-solid layer of security to your BI…

How-To
Administrators occasionally need to check complicated settings and security structures for users. Sometimes the easiest…

How-To
Pyramid lets users customize and personalize the labels of value metrics and hierarchies for a…

How-To
Static data format masks, used to format values in analytics) is a standard feature in…

How-To
Pyramid lets users display multiple value metrics in a single report, each with its own…

How-To
Pyramid’s persistent color feature maintains the same color in all visualizations for selected data elements,…

How-To
Pyramid offers flexible, intuitive security for parent-child hierarchies, providing role-based control over how members are viewed…

How-To
Pyramid excels in its’ native support for parent-child hierarchies, automatically generating hierarchical structures and providing fluid,…