- Solutions
-
-
Featured Solution
 Get more value from your existing SAP BW and SAP HANA investments with our SAP integrations.
-
-


2020.10 is the latest release from Pyramid Analytics. It extends the functionality introduced in our major 2020 release. This is one in a series of posts that highlights some of the major new features.
In a previous blog, [link here], I discussed Pyramid’s capability to deliver both data catalogs and content catalogs. In this post, I’ll explore some of the key aspects of the data catalog capabilities we introduced in 2020.10. This infrastructure provides users with a self-building and self-maintaining documentation mechanism for data and analytics.
By extending the classic data catalog concept, Pyramid can further provide specialized tools (the “toolkit”) to solve difficult, everyday business problems in analytics and reporting.
A single, central data catalog ensures a single version of the truth for all data definitions, formulas, reports, and all other data assets. Without it, chaos reigns, and data governance becomes extremely difficult to achieve. A decentralized data catalog increases confusion regarding which definition should be used, encourages duplication of definitions, and undermines the concept of “a single version of the truth.”
Users often modify elements in a data model and unwittingly “break” all content (i.e., reports, dashboards, formulas, and publications) that use the modified element without realizing the consequences of the change. Users wishing to change content need to know in advance about all other (upstream and downstream) content that might be affected by the change.
Users needing to change a data source for multiple content items must perform the laborious task of repeatedly opening the content and changing the data source for multiple content items. Some BI tool vendors (such as Power BI and Tableau) encourage users to utilize desktop tools and consequently use local definitions of data and artifacts. Alternatively, many tools (including Qlik and Sisense, for example) only let users build analytical content in projects. Both approaches contradict the entire concept of performing tasks on a single version of the truth across an entire set of centralized server-based content and data definitions.
Pyramid addresses data cataloging with a powerful approach based on its server-based architecture, shareable data models, centralized business logic, and reporting. A classic data catalog provides universal documentation on the data model, including data sources, targets, and the ETL process. Pyramid delivers this and expands the classic data catalog to include all analytical content as well. It creates a self-building, self-maintained data catalog that interconnects the data elements and the analytical content elements in the system at all levels, all the time. Pyramid provides capabilities for users to add and adjust descriptions.
Users can access the catalog in one of several ways:
The catalog details are exposed to the right users (based on security) at the right time—solving both the headache of sharing information and governance in one step.
Pyramid then extends the notion of data catalogs to the next level: by building derived functionality that pivots around the cohesive, interconnected tracking of data assets and analytic content. This is best evidenced in three tools:
Lynn, a business analyst at XYZ Retail Inc., is using Pyramid to perform analytics on her Redshift data warehouse. There has recently been a big revamp to the system; some new columns have replaced old ones.
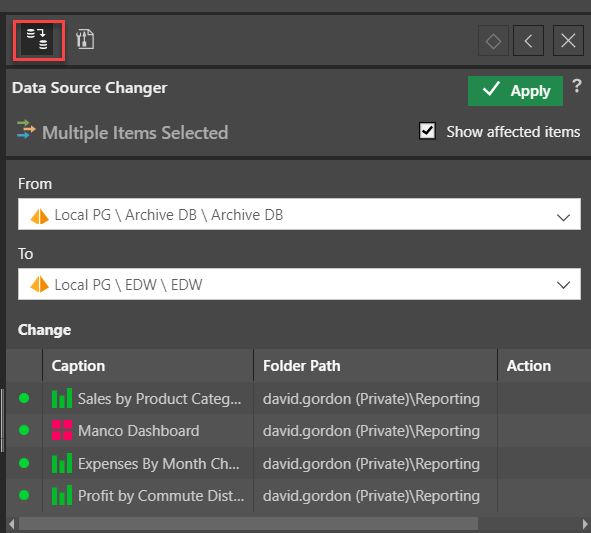
In addition, a new revised and updated data source (EDW XYZ Retail) will be replacing the old data source (Archive DB XYZ Retail) for multiple reports, and Lynn would also like to review the knock-on effect of changing some content items for the sales grid that appears in her Manco Dashboard. Lynn uses Pyramid for analytics and plans to solve these data structure problems with its powerful and comprehensive tools.
Initially, Lynn changes the data source for three reports and a dashboard from the old source (Archive), to the new source (EDW) where all the new columns exist. Lynn uses the content explorer to select her 150 reports and 12 dashboards and then runs the Data Source Changer tool. The tool expedites the changing of data sources for multiple content items by simply selecting the “from” and “to” data sources from a dropdown menu. All the affected items are displayed, and with a click on “Apply”, the data source has been changed for all reports and dashboards—including any related content used in these items like calculations, lists, parameters, and infographics.
Next, Lynn needs to analyze her content to find and fix all the inconsistencies between the old and new data source. When Lynn opens her 12 dashboards (and its embedded reports and logic), or any of the 150 reports, no data is displayed as the columns in the reports do not exist in the new data model. Instead of manually opening and correcting each report and calculation individually (some 200+ items), Lynn can run the Structure Analyzer tool to do all the work for her.
The tool automatically identifies six issues that must be resolved across all the items in the inventory. For example, the first error shown below, the “product” dimension needs to be fixed because it cannot be found. So, Lynn needs to choose an alternative (maybe “products”). Making the change can optionally then be cascaded across the entire inventory to apply the correction.
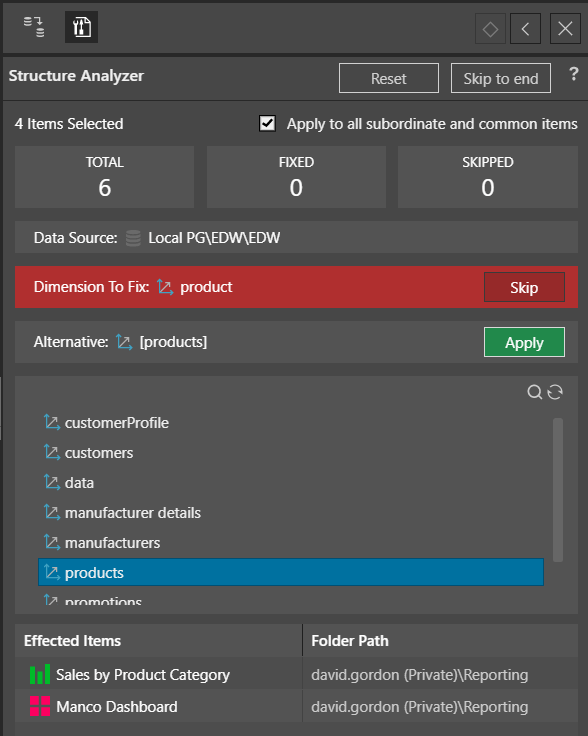
The tool then guides Lynn through all subsequent errors and is afforded the opportunity to correct them for all affected reports in a single click. Lynn can now open her dashboards and reports without issue, reducing the arduous task of manually fixing many reports to just a few simple clicks.
Before making substantial changes to any content, Lynn would like to see all related items. From the content item in the explorer, Lynn can use the lineage tool. Pyramid displays a graphical image depicting the items and all related content downstream from it. The items are color-coded to indicate what type of content it is: dashboards (red), reports (green), formulas (orange), publications (blue), or illustrations (purple). Here, the Growth Rate report (green) has two formulas (orange) and one illustration (yellow). Additional metadata with additional information about the selected content is displayed on the right-hand side.
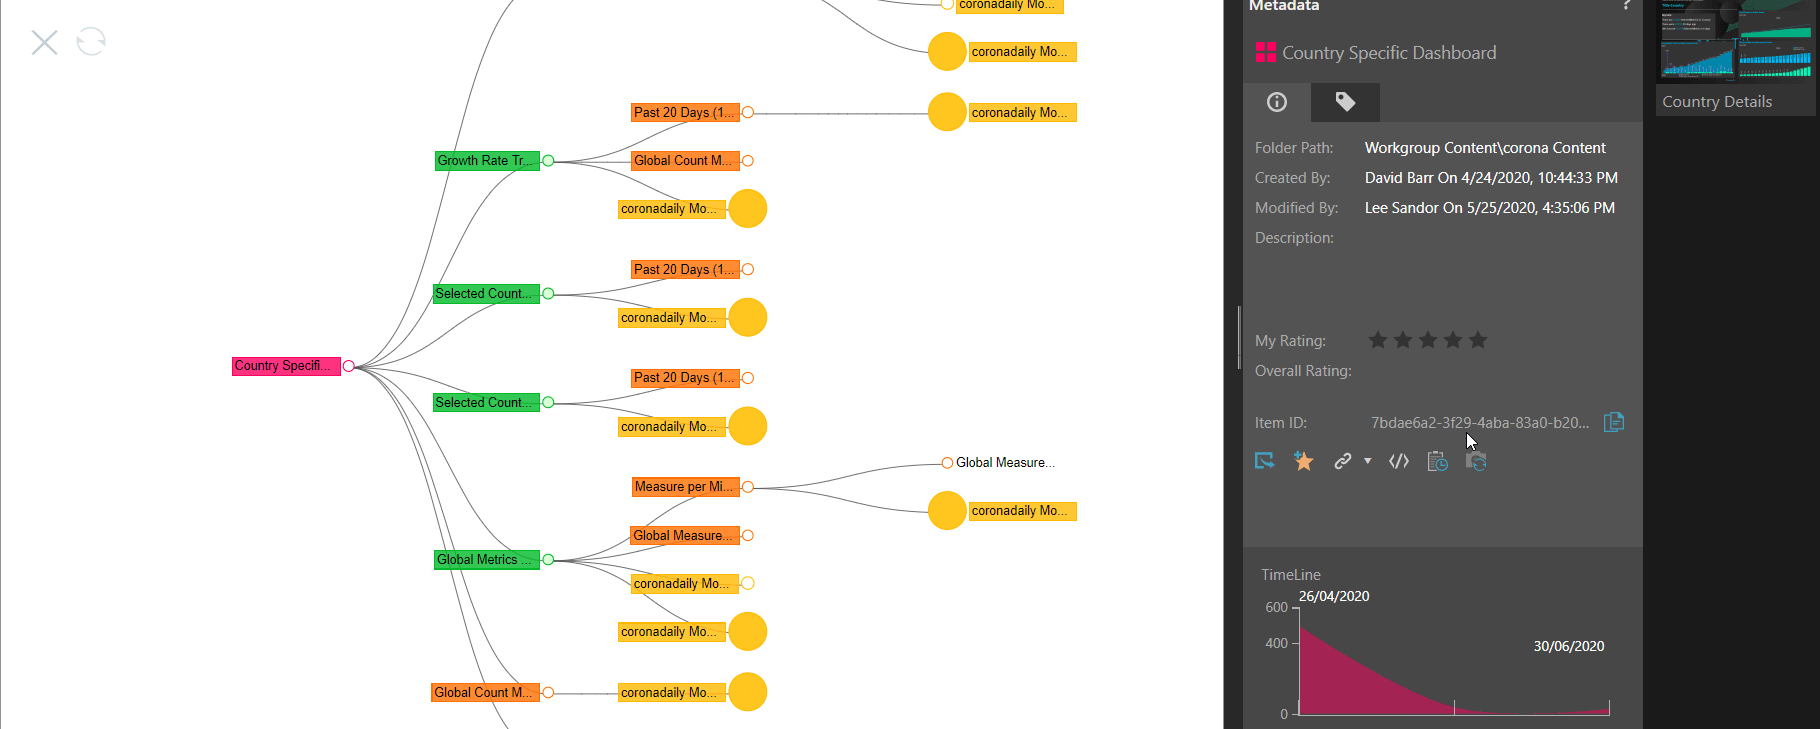
From this report, Lynn can select any content item on the diagram (with a right click) and perform a range of actions, including starting a new tree or fetching upstream/downstream content. This provides Lynn with a clear way to comprehensively analyze the entire environment before embarking on modifications to any single content item.
Pyramid’s powerful strategy of providing both data and content catalogs expedites the use of specialized tools to solve difficult, everyday business problems where these two catalogs interconnect. The Pyramid approach stands in strong contrast to desktop-based analytical tools (or tools) that encourage the use of siloed data and analytical projects: both of which cannot build or utilize centralized data cataloging functions that can be accessed by all authorized users in a common, consistent, and cohesive manner.
Pyramid’s Structure Analyzer, Data Source Changer and Lineage tool provides a graphical, intuitive set of mechanisms to all the elements in the system, fully exploiting the power of centralized data and asset cataloging.
The three tools highlight Pyramid’s commitment to providing self-service BI tools that remove the technical burden from the BI end-user, while still delivering an enterprise, governable framework for high-scale analytic solutions.
Pyramid 2020.10 is chock full of powerful features like the data catalog toolkit items described above. For more detail about some of the other new headline features contained in the 2020.10 release, please see these additional write-ups:

How-To
SAP is essential enterprise software. Your organization has made significant investments in SAP. You've tailored…

How-To
Pyramid’s built-in multi-factor authentication (MFA) option adds a rock-solid layer of security to your BI…

How-To
Administrators occasionally need to check complicated settings and security structures for users. Sometimes the easiest…

How-To
Pyramid lets users customize and personalize the labels of value metrics and hierarchies for a…
How-To
Static data format masks, used to format values in analytics) is a standard feature in…
How-To
Pyramid lets users display multiple value metrics in a single report, each with its own…

How-To
Pyramid’s persistent color feature maintains the same color in all visualizations for selected data elements,…

How-To
Pyramid offers flexible, intuitive security for parent-child hierarchies, providing role-based control over how members are viewed…
How-To
Pyramid excels in its’ native support for parent-child hierarchies, automatically generating hierarchical structures and providing fluid,…